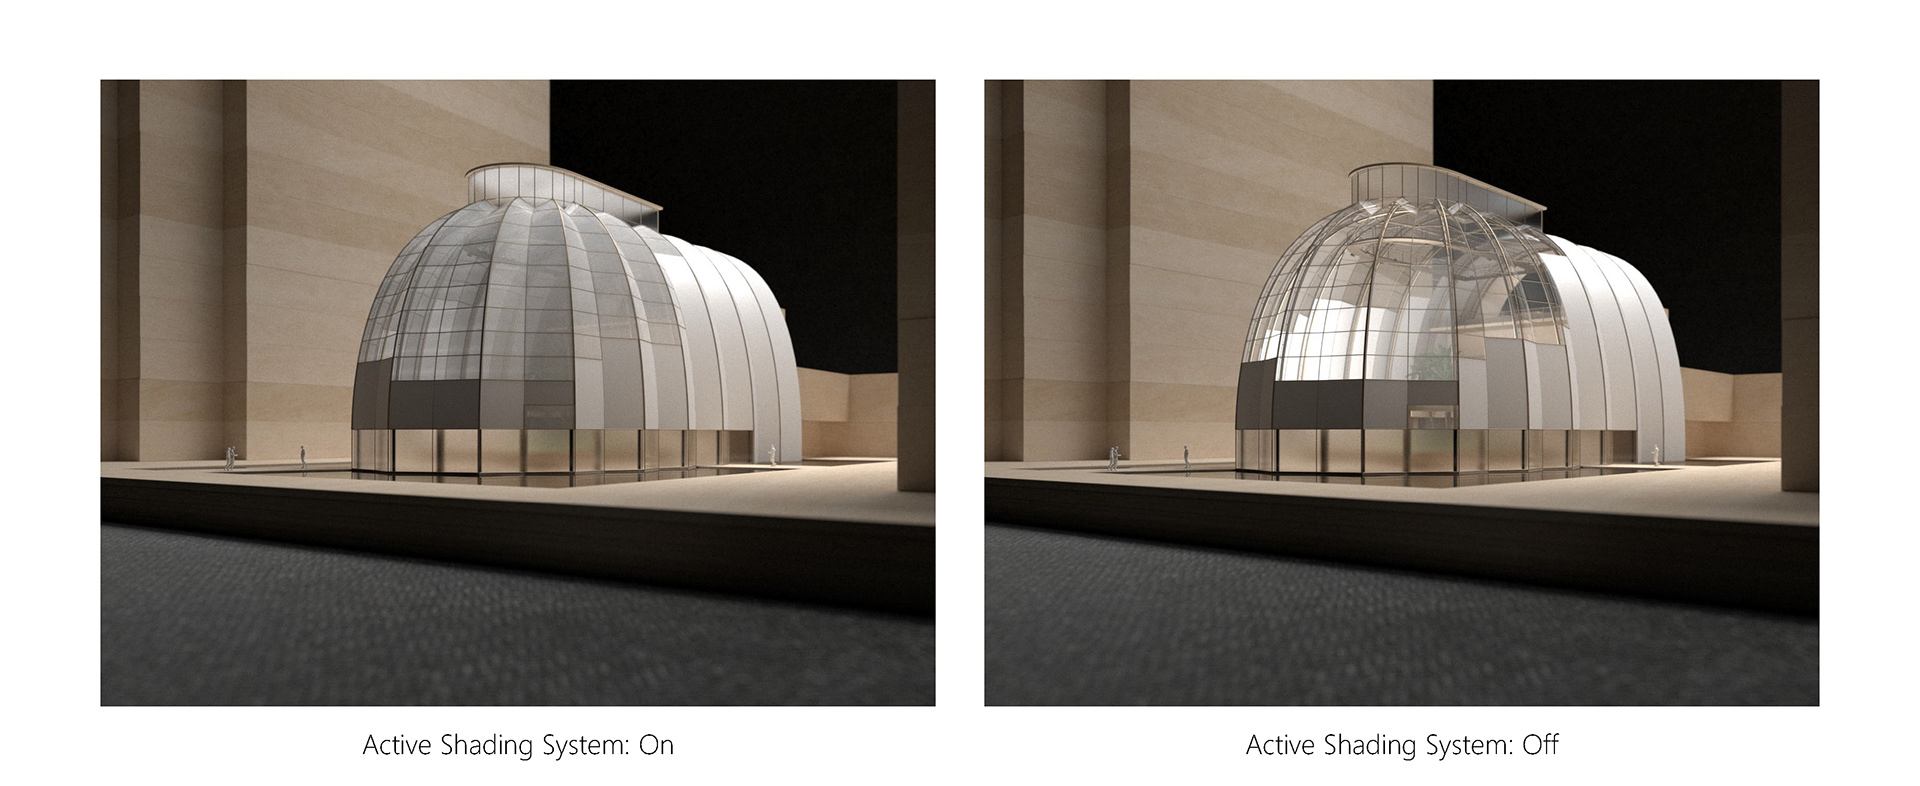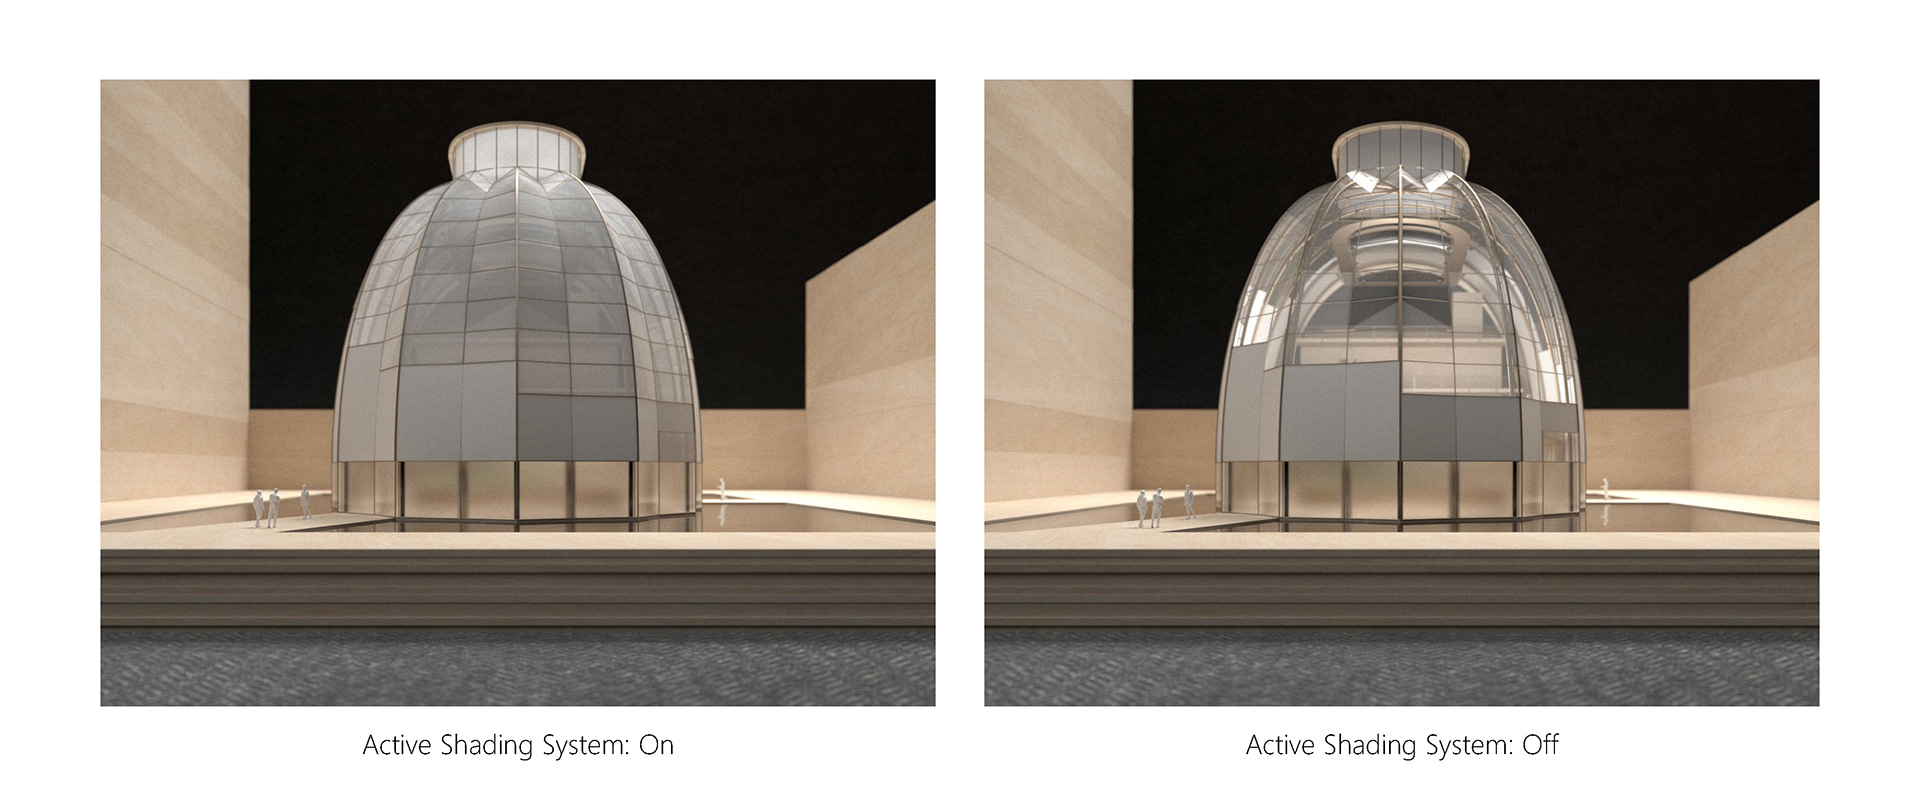
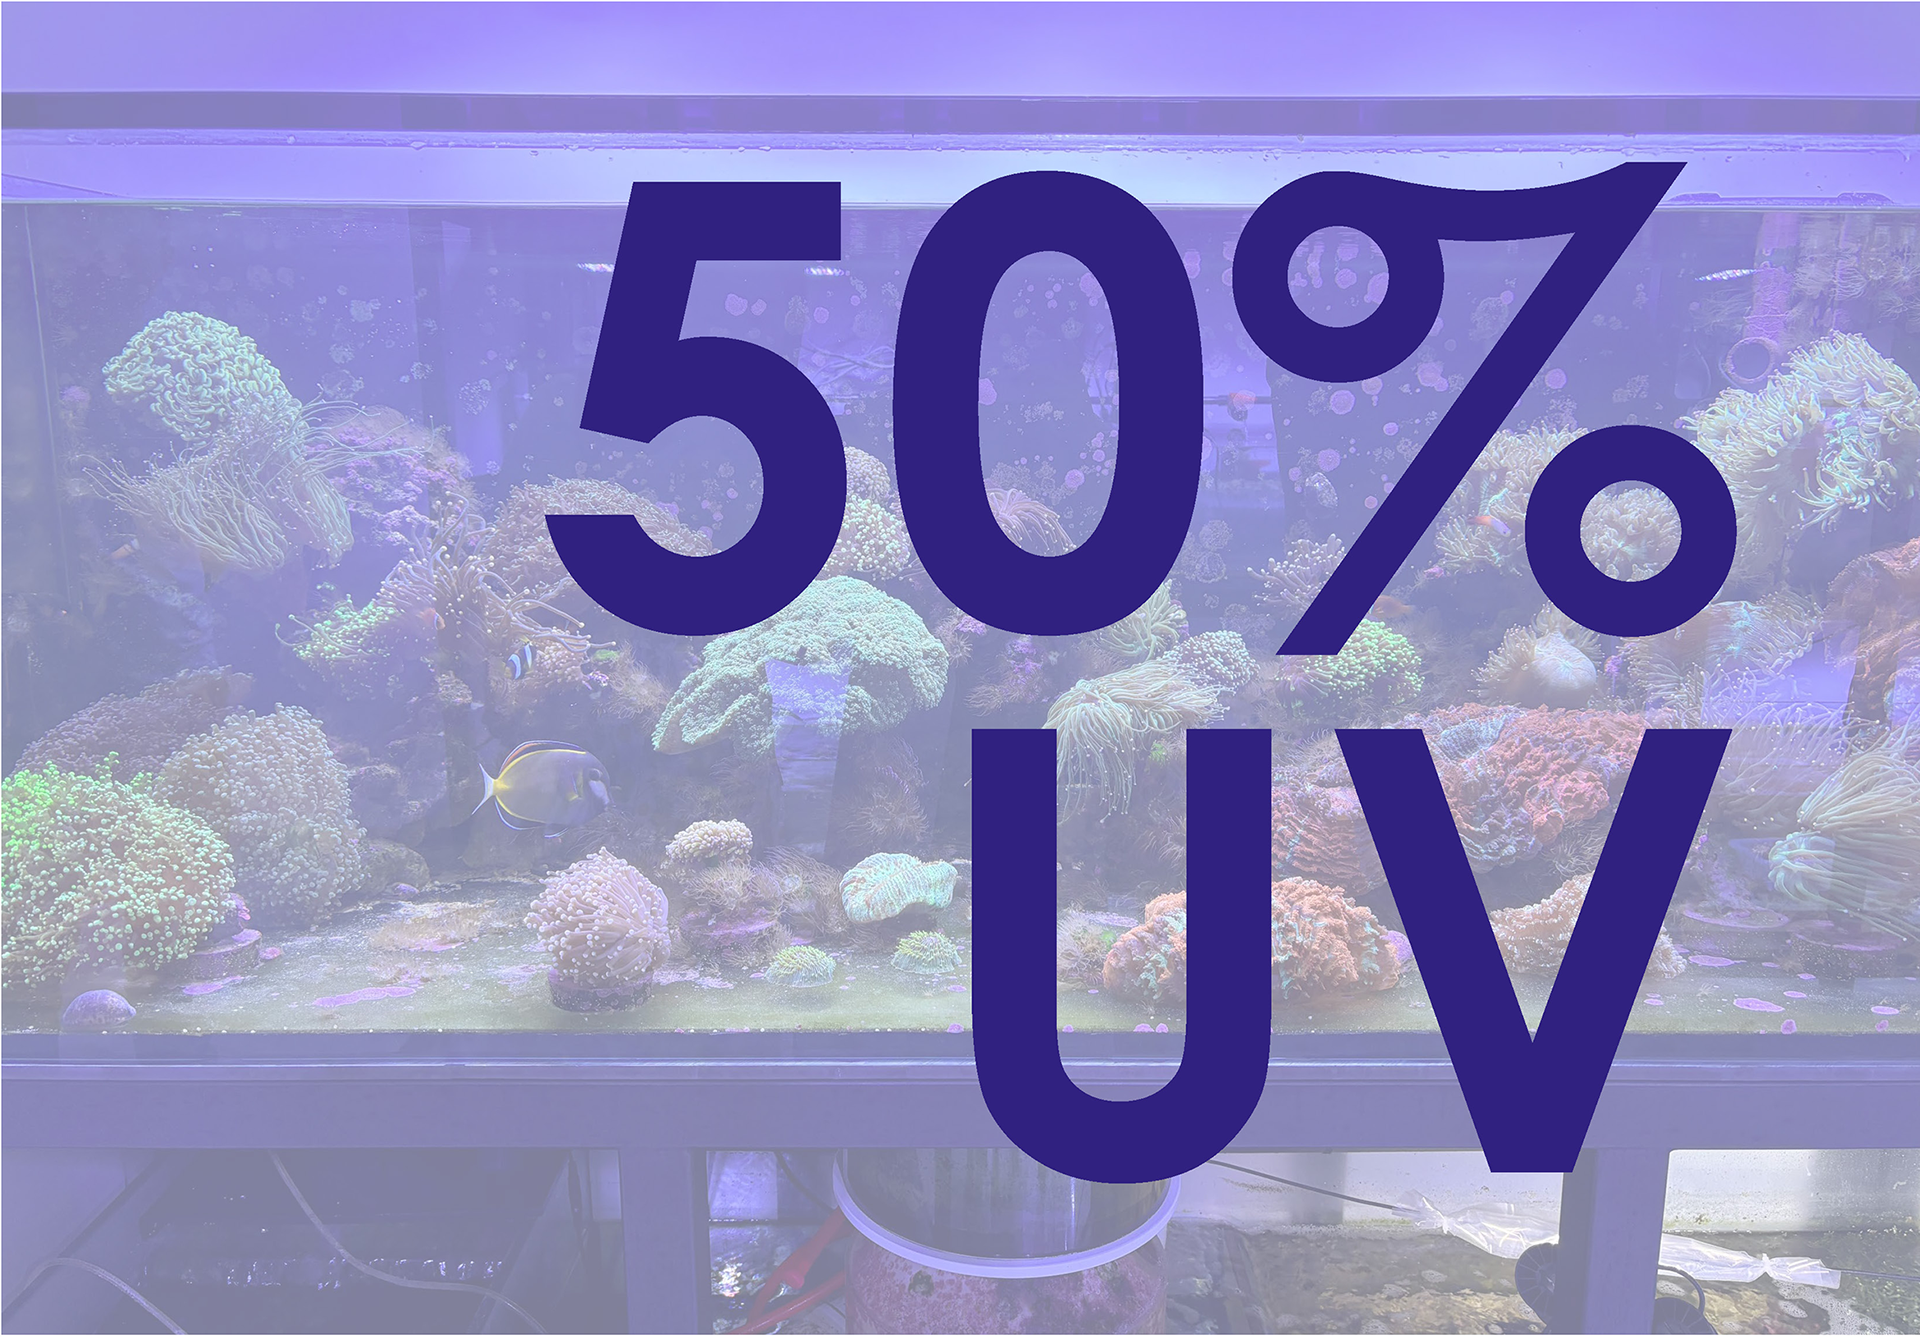
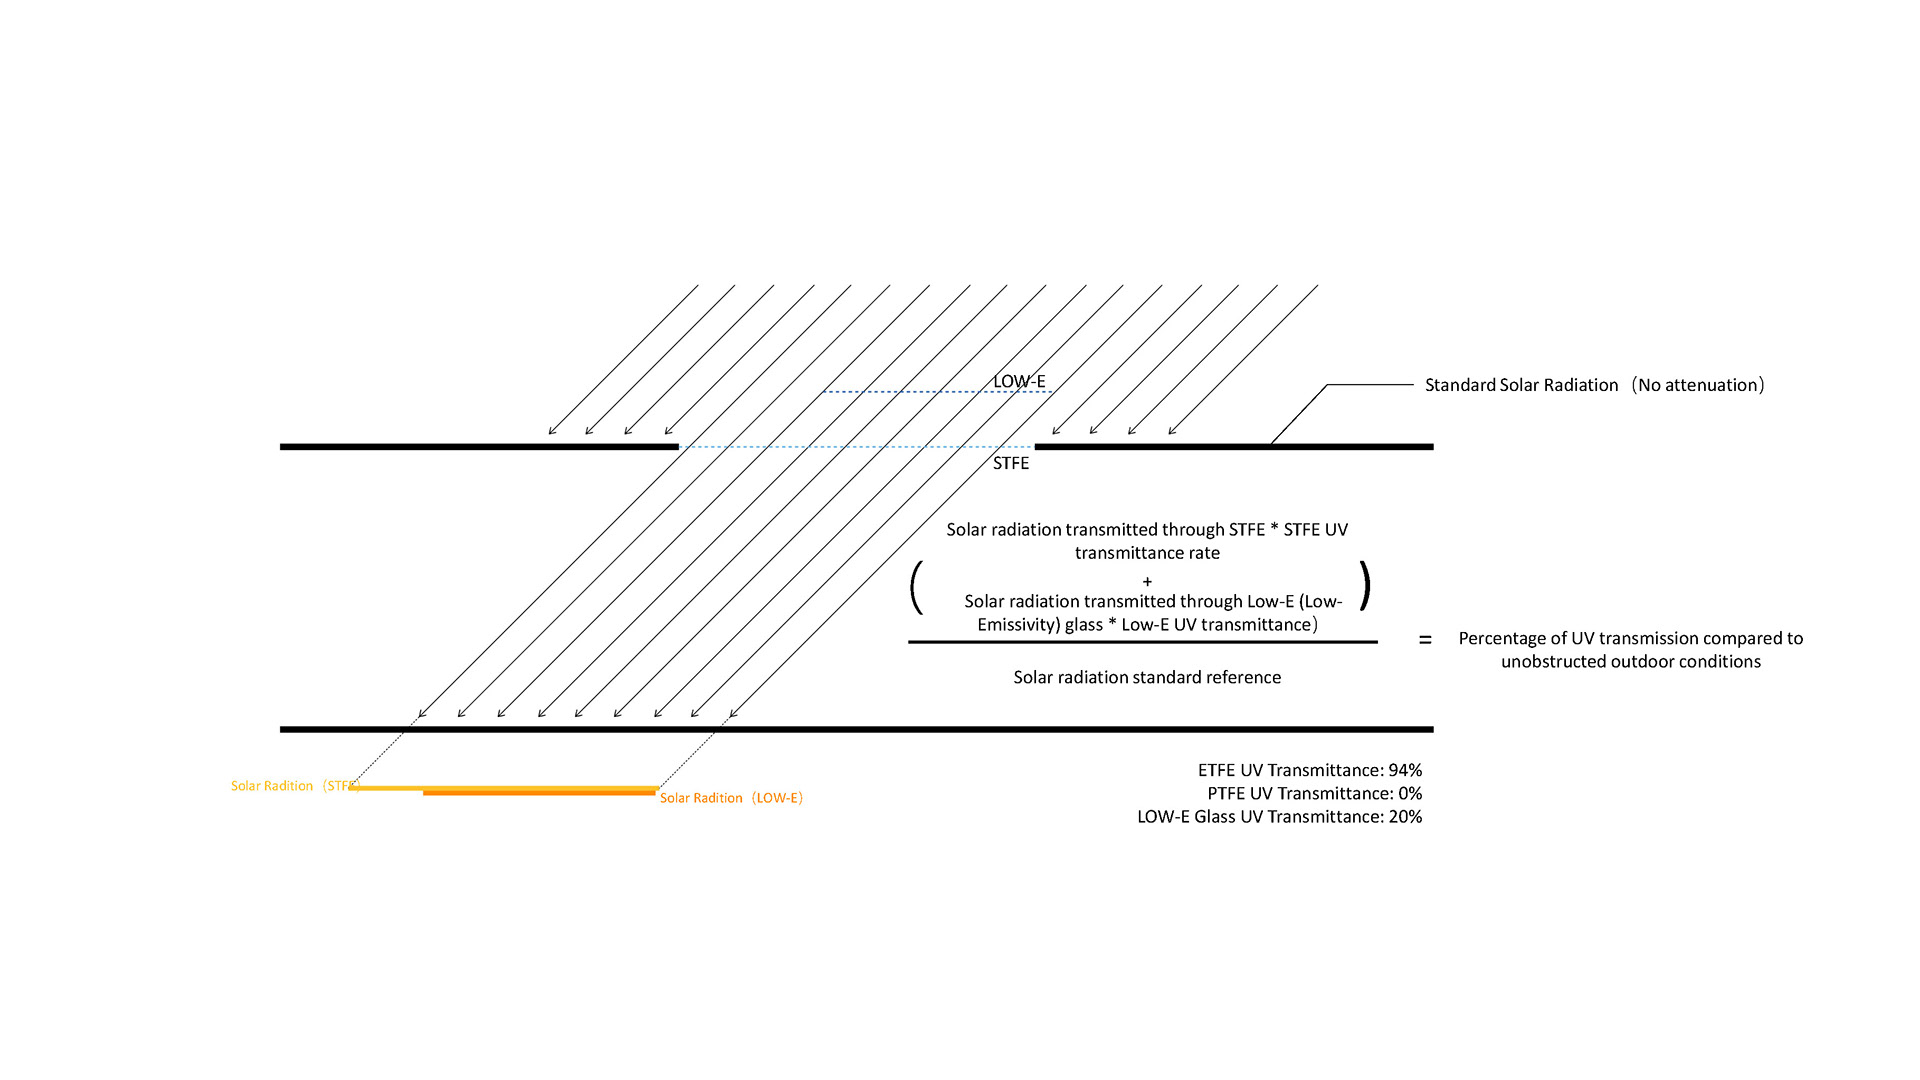
Grasshopper does not directly calculate UV intensity, but a workaround was implemented. Since UV rays consistently make up a fixed percentage of total sunlight, the approach was reversed: instead of tracking UV levels, total sun radiation was controlled. Full sunlight radiation was first measured as a baseline. Then, parametric shading was applied to reduce sunlight by 50% over the coral tanks, which automatically brought UV levels down to the required 50%. This back-calculation method eliminated the need for complex light spectrum analysis, effectively transforming the shading system into a precision light filter.
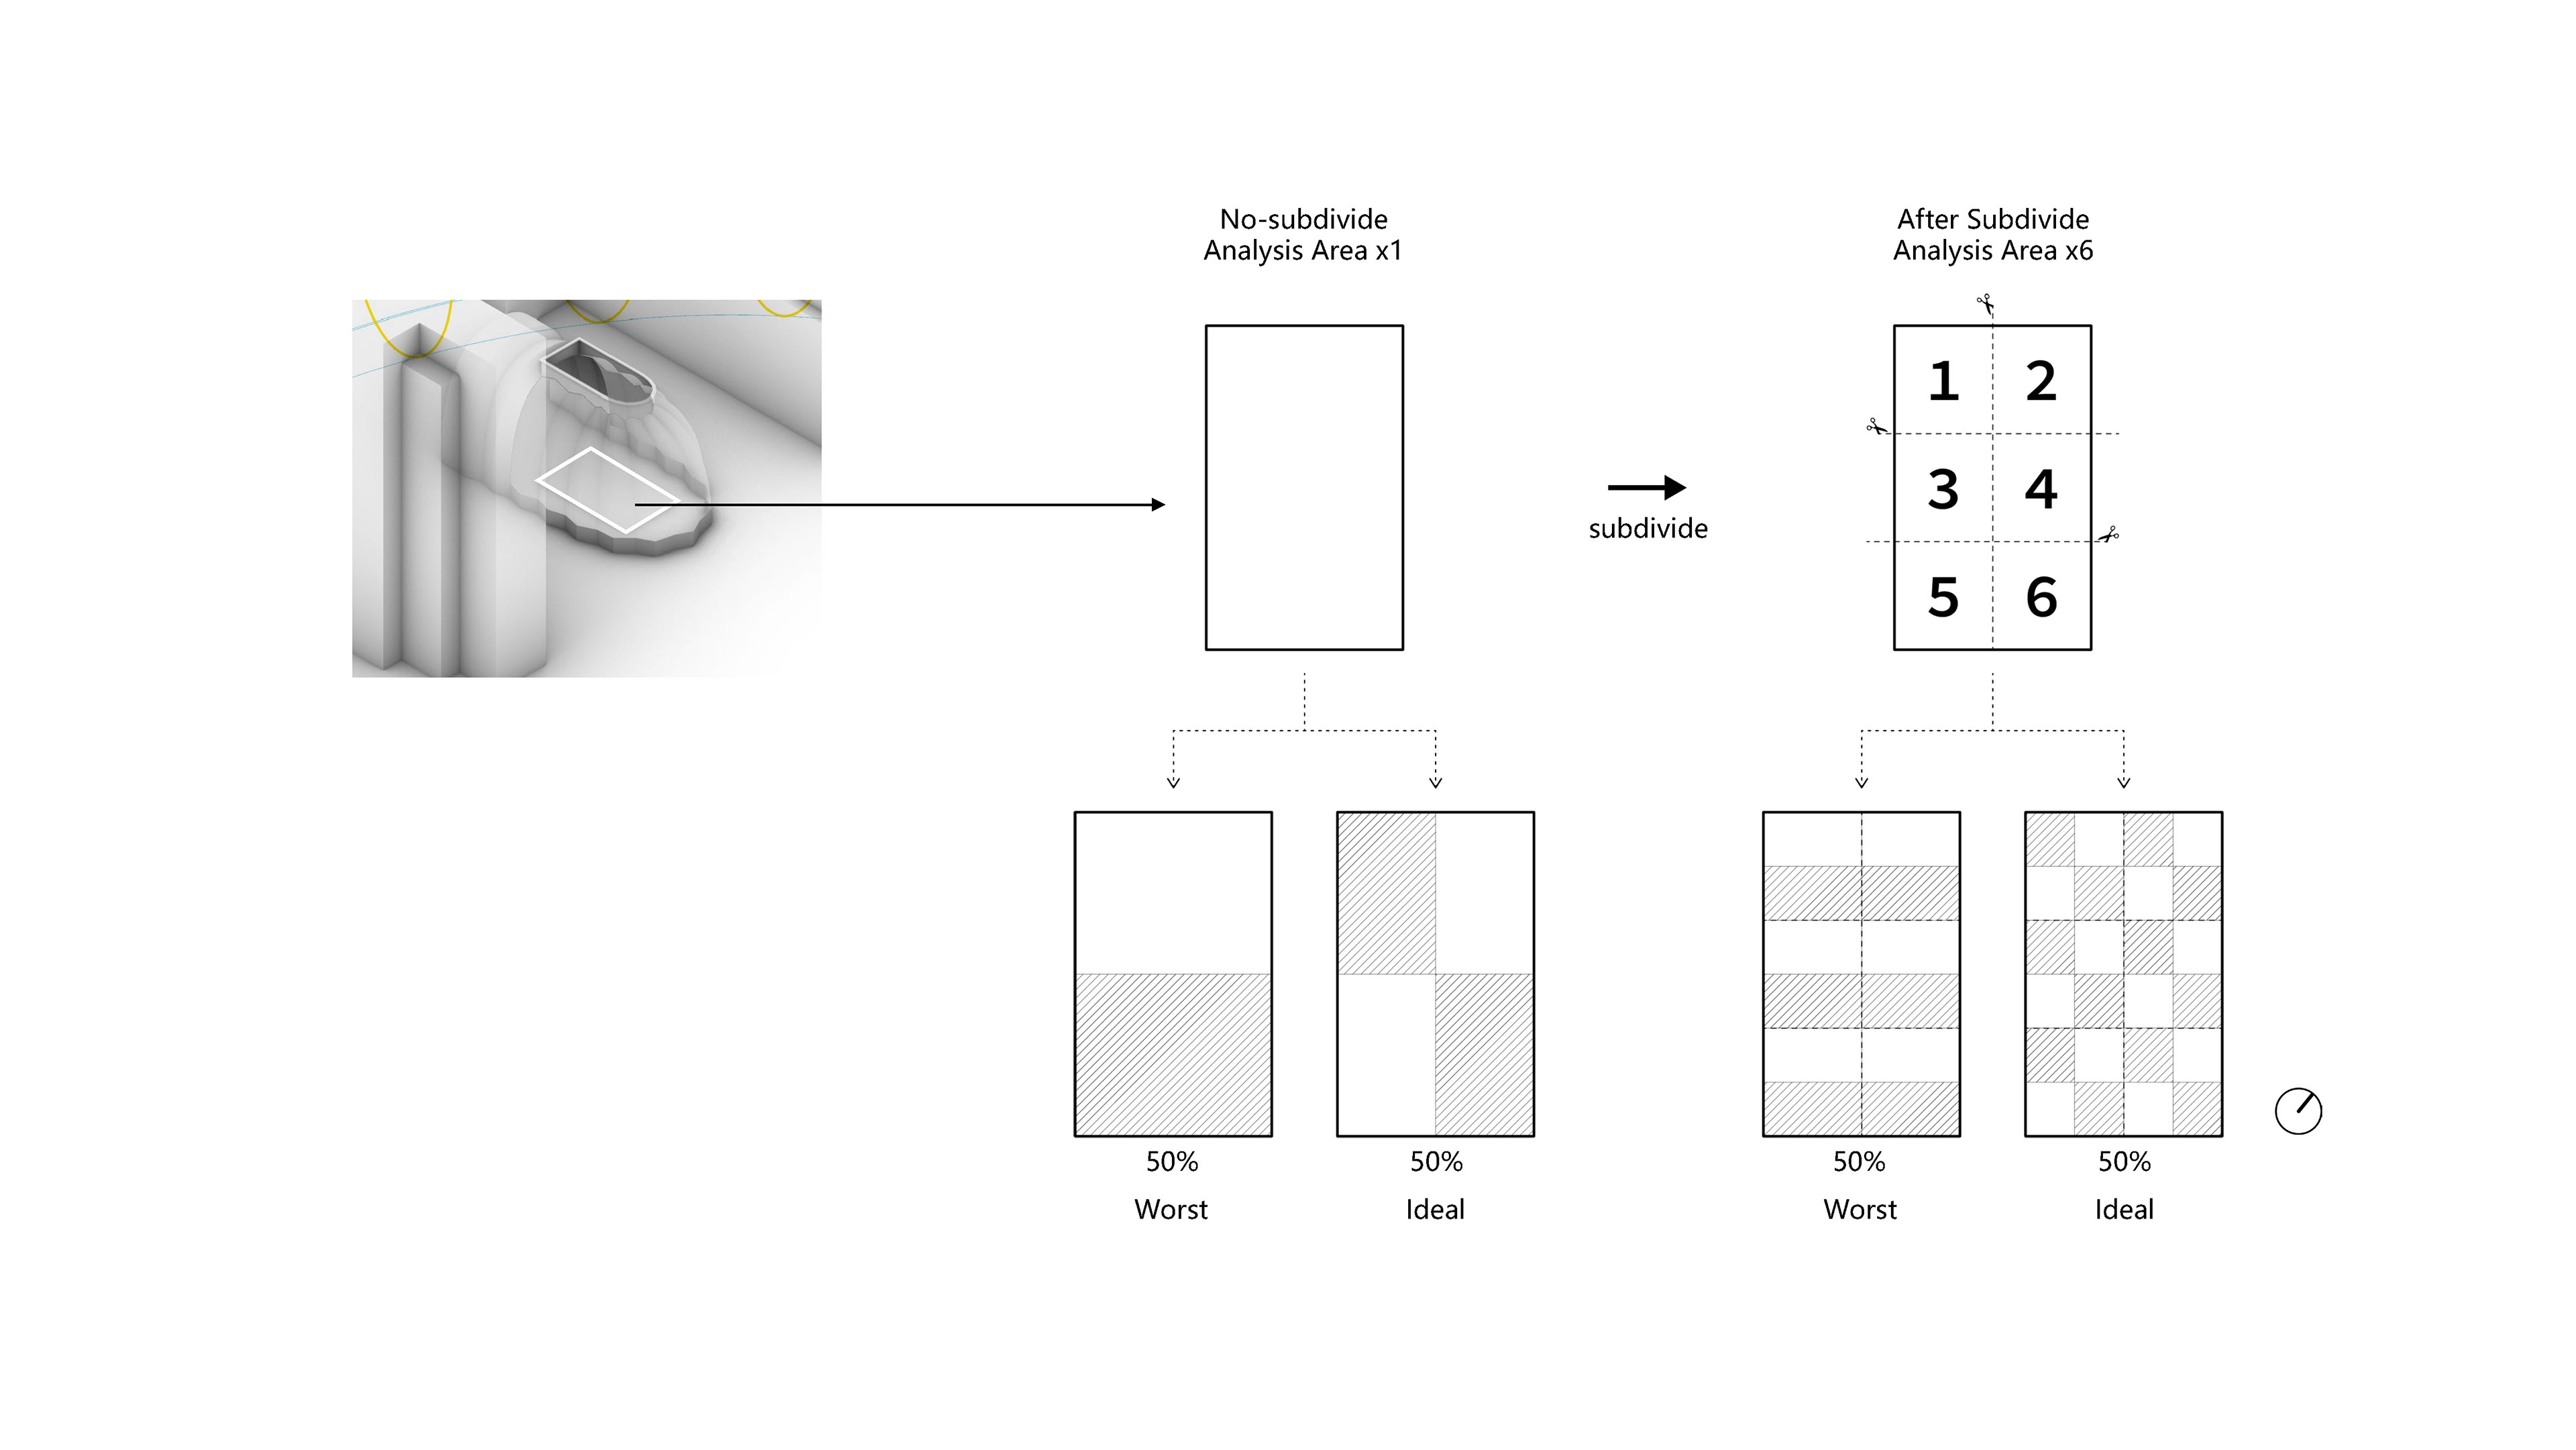
The analytical diagrams illustrate multiple light distribution scenarios when the target of 50% UV intensity is achieved within the study area. The design objective requires maintaining an average UV intensity at 50% of completely unobstructed conditions while ensuring uniform distribution. To achieve this, the analytical area was subdivided into six smaller zones, followed by iterative performance evaluations for each subzone.
During solar radiation simulations for the coral tanks, the approach shifted from whole-pool control to grid-based analysis. Measuring solar exposure across an entire pool without localized analysis could lead to extreme variations—similar to assessing room temperature with a single central sensor reading 25°C, while window areas could reach 30°C and corners drop to 20°C. Likewise, averaging solar radiation across the entire pool could create critical imbalances, with full exposure on the east side and total shade on the west. To mitigate this, the pool was divided into six smart grids, ensuring each cell maintains a precise 50% solar radiation level.
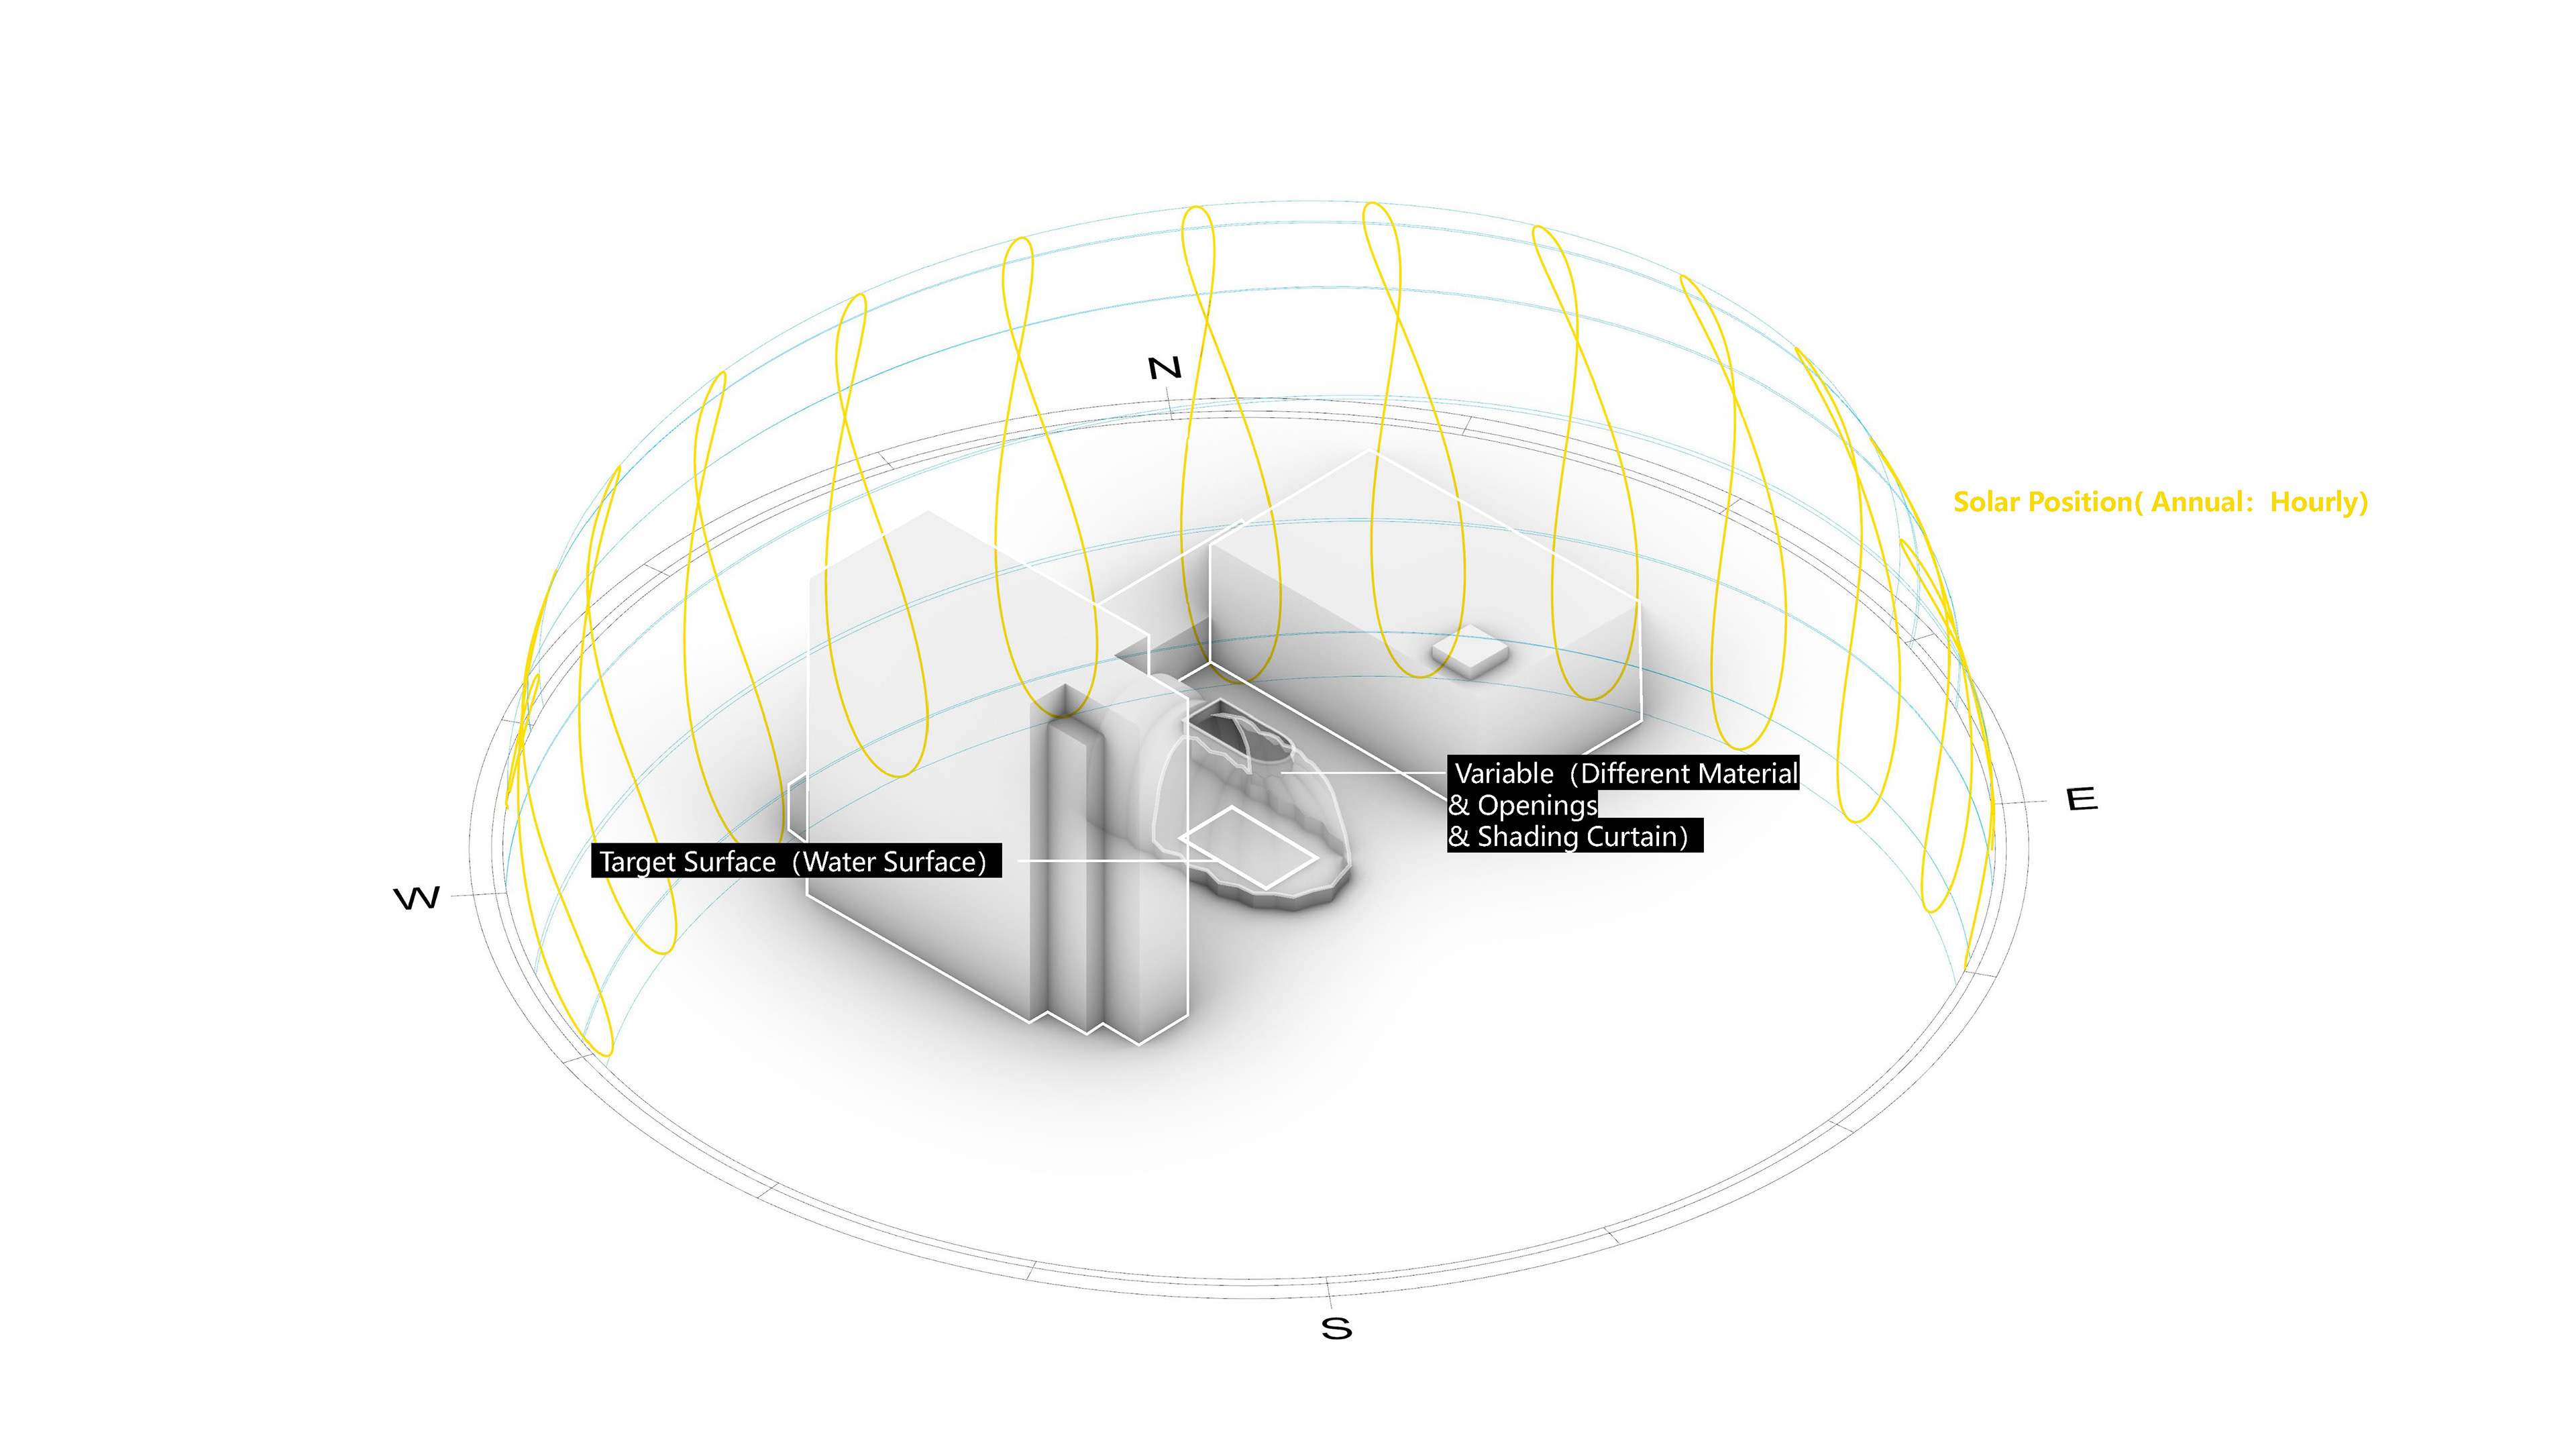
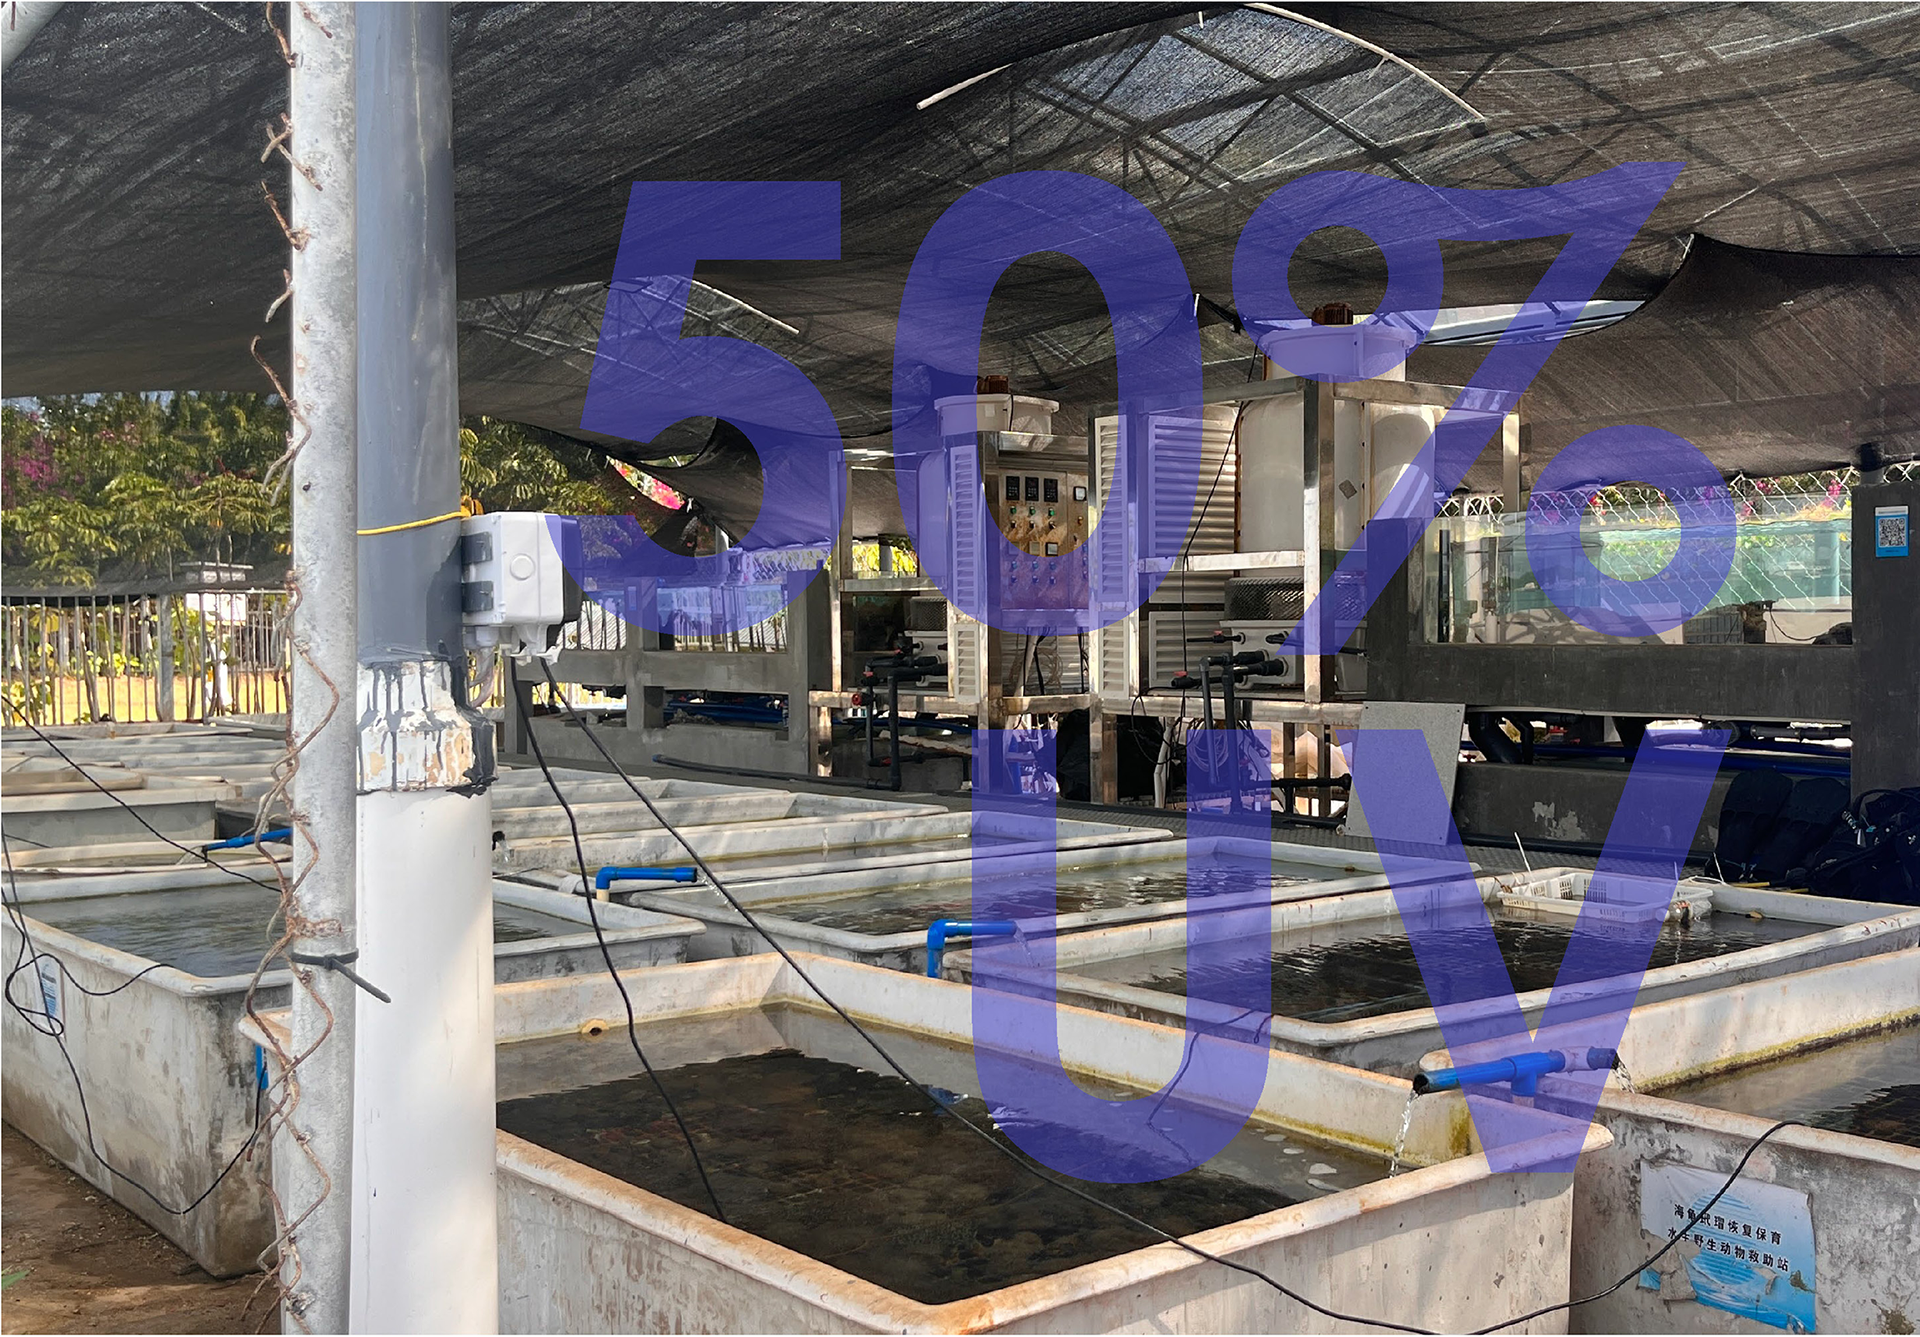
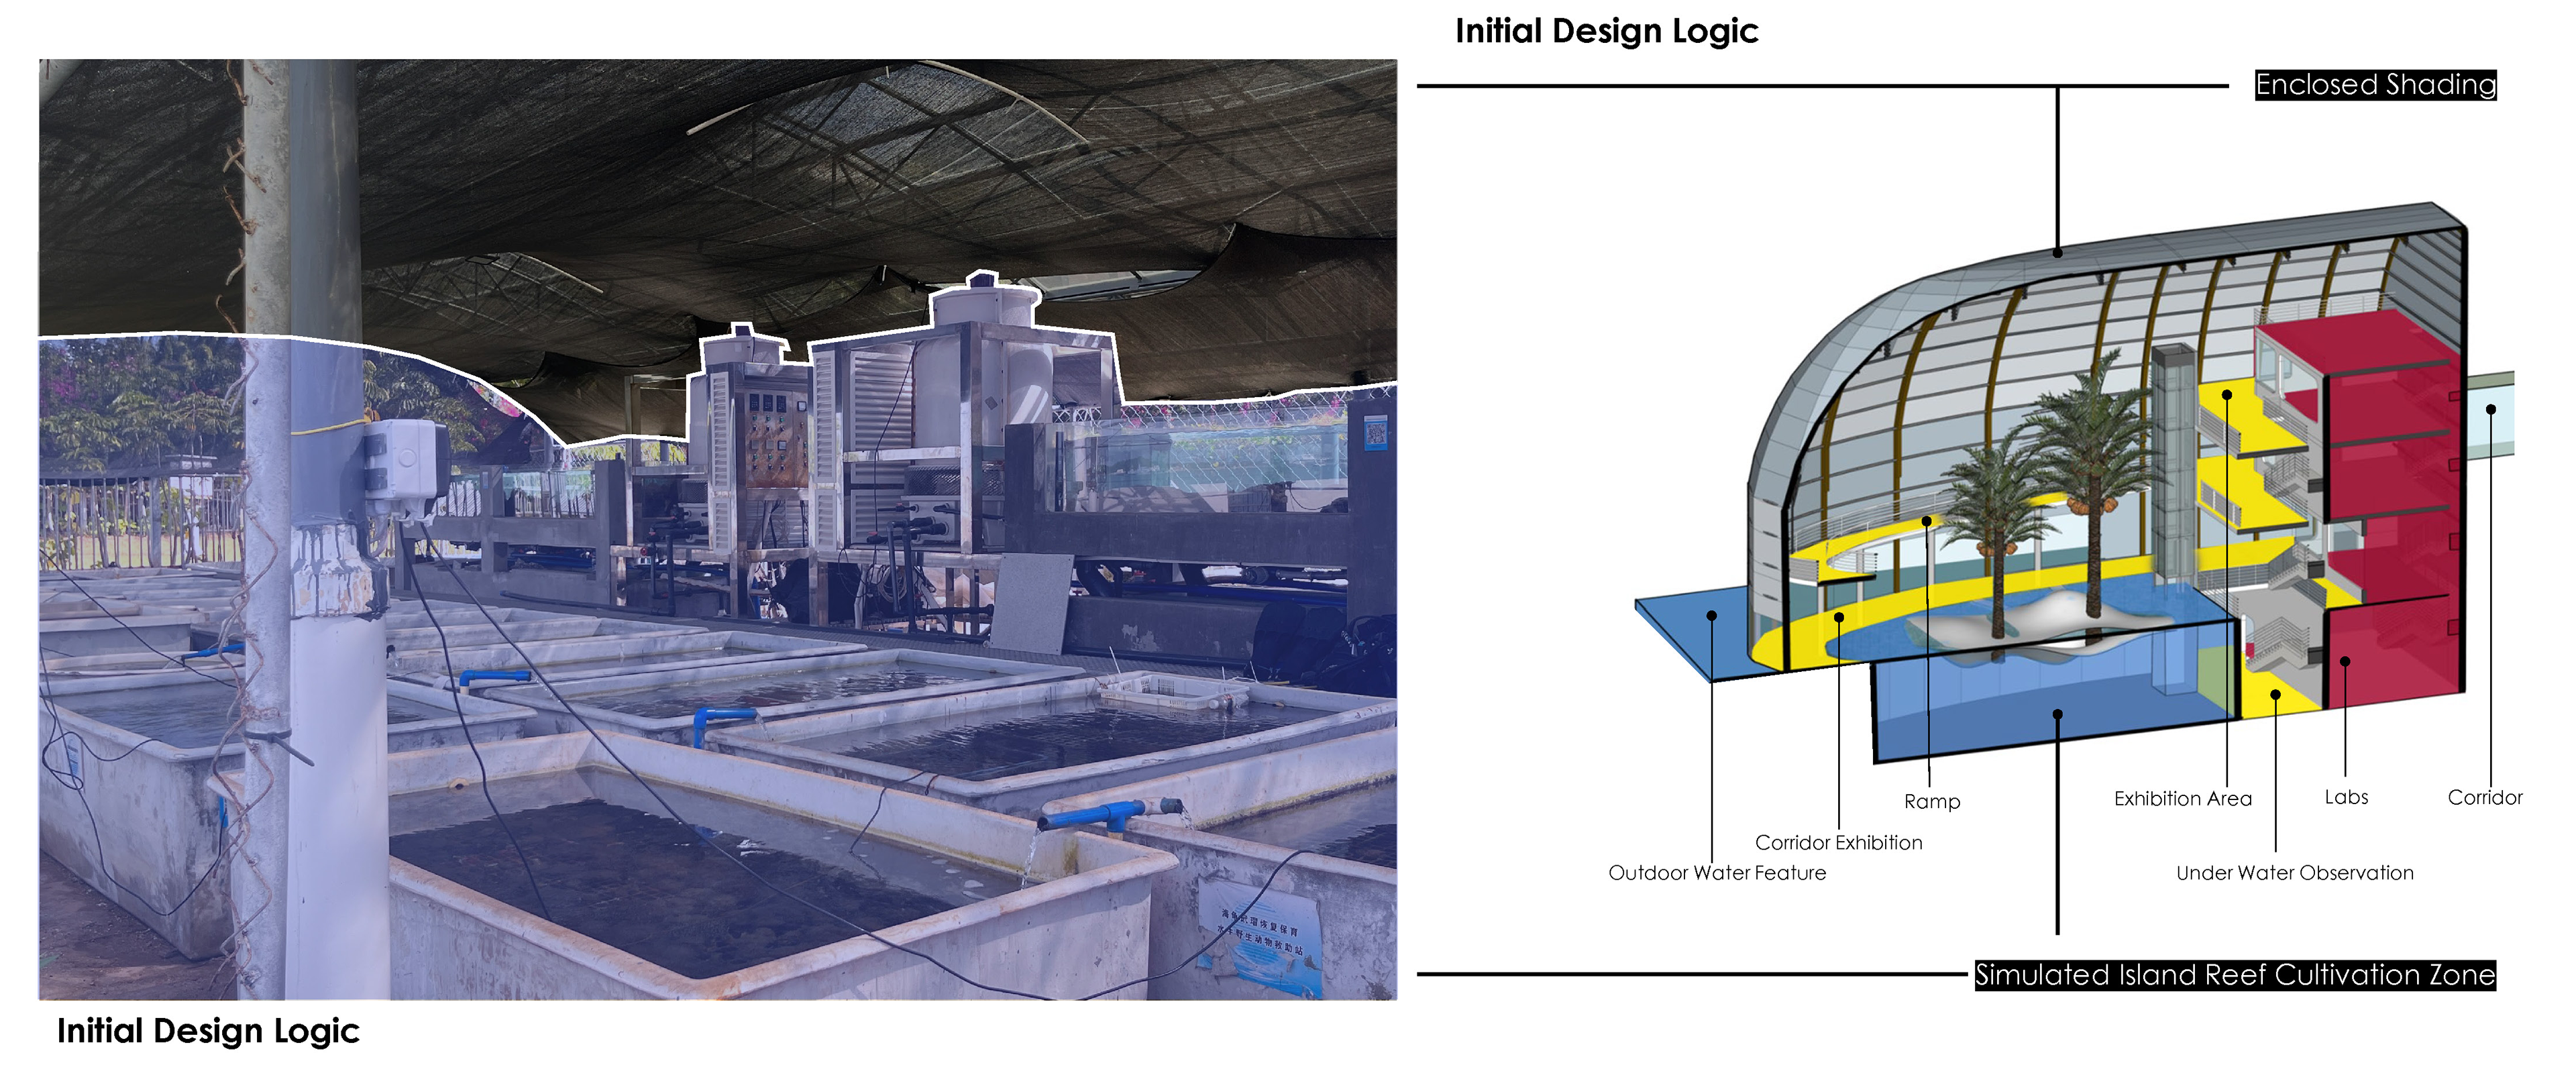
This study is based on the fundamental proportionality between UV intensity and solar irradiance. By strategically engineering perforations in membrane structures and incorporating material variations—including ETFE, STFE, and PTFE—the design aims to achieve an average UV intensity equivalent to 50% of full, unobstructed sunlight within the coral cultivation pools. On a broader site scale, the coral cultivation tanks are positioned within a grid of white-marked target surfaces. Two existing high-rise buildings, located diagonally to the southwest and northeast, act as natural light barriers. While these structures provide built-in shading, they also introduce complex lighting angles, requiring careful calibration to maintain consistent solar exposure.
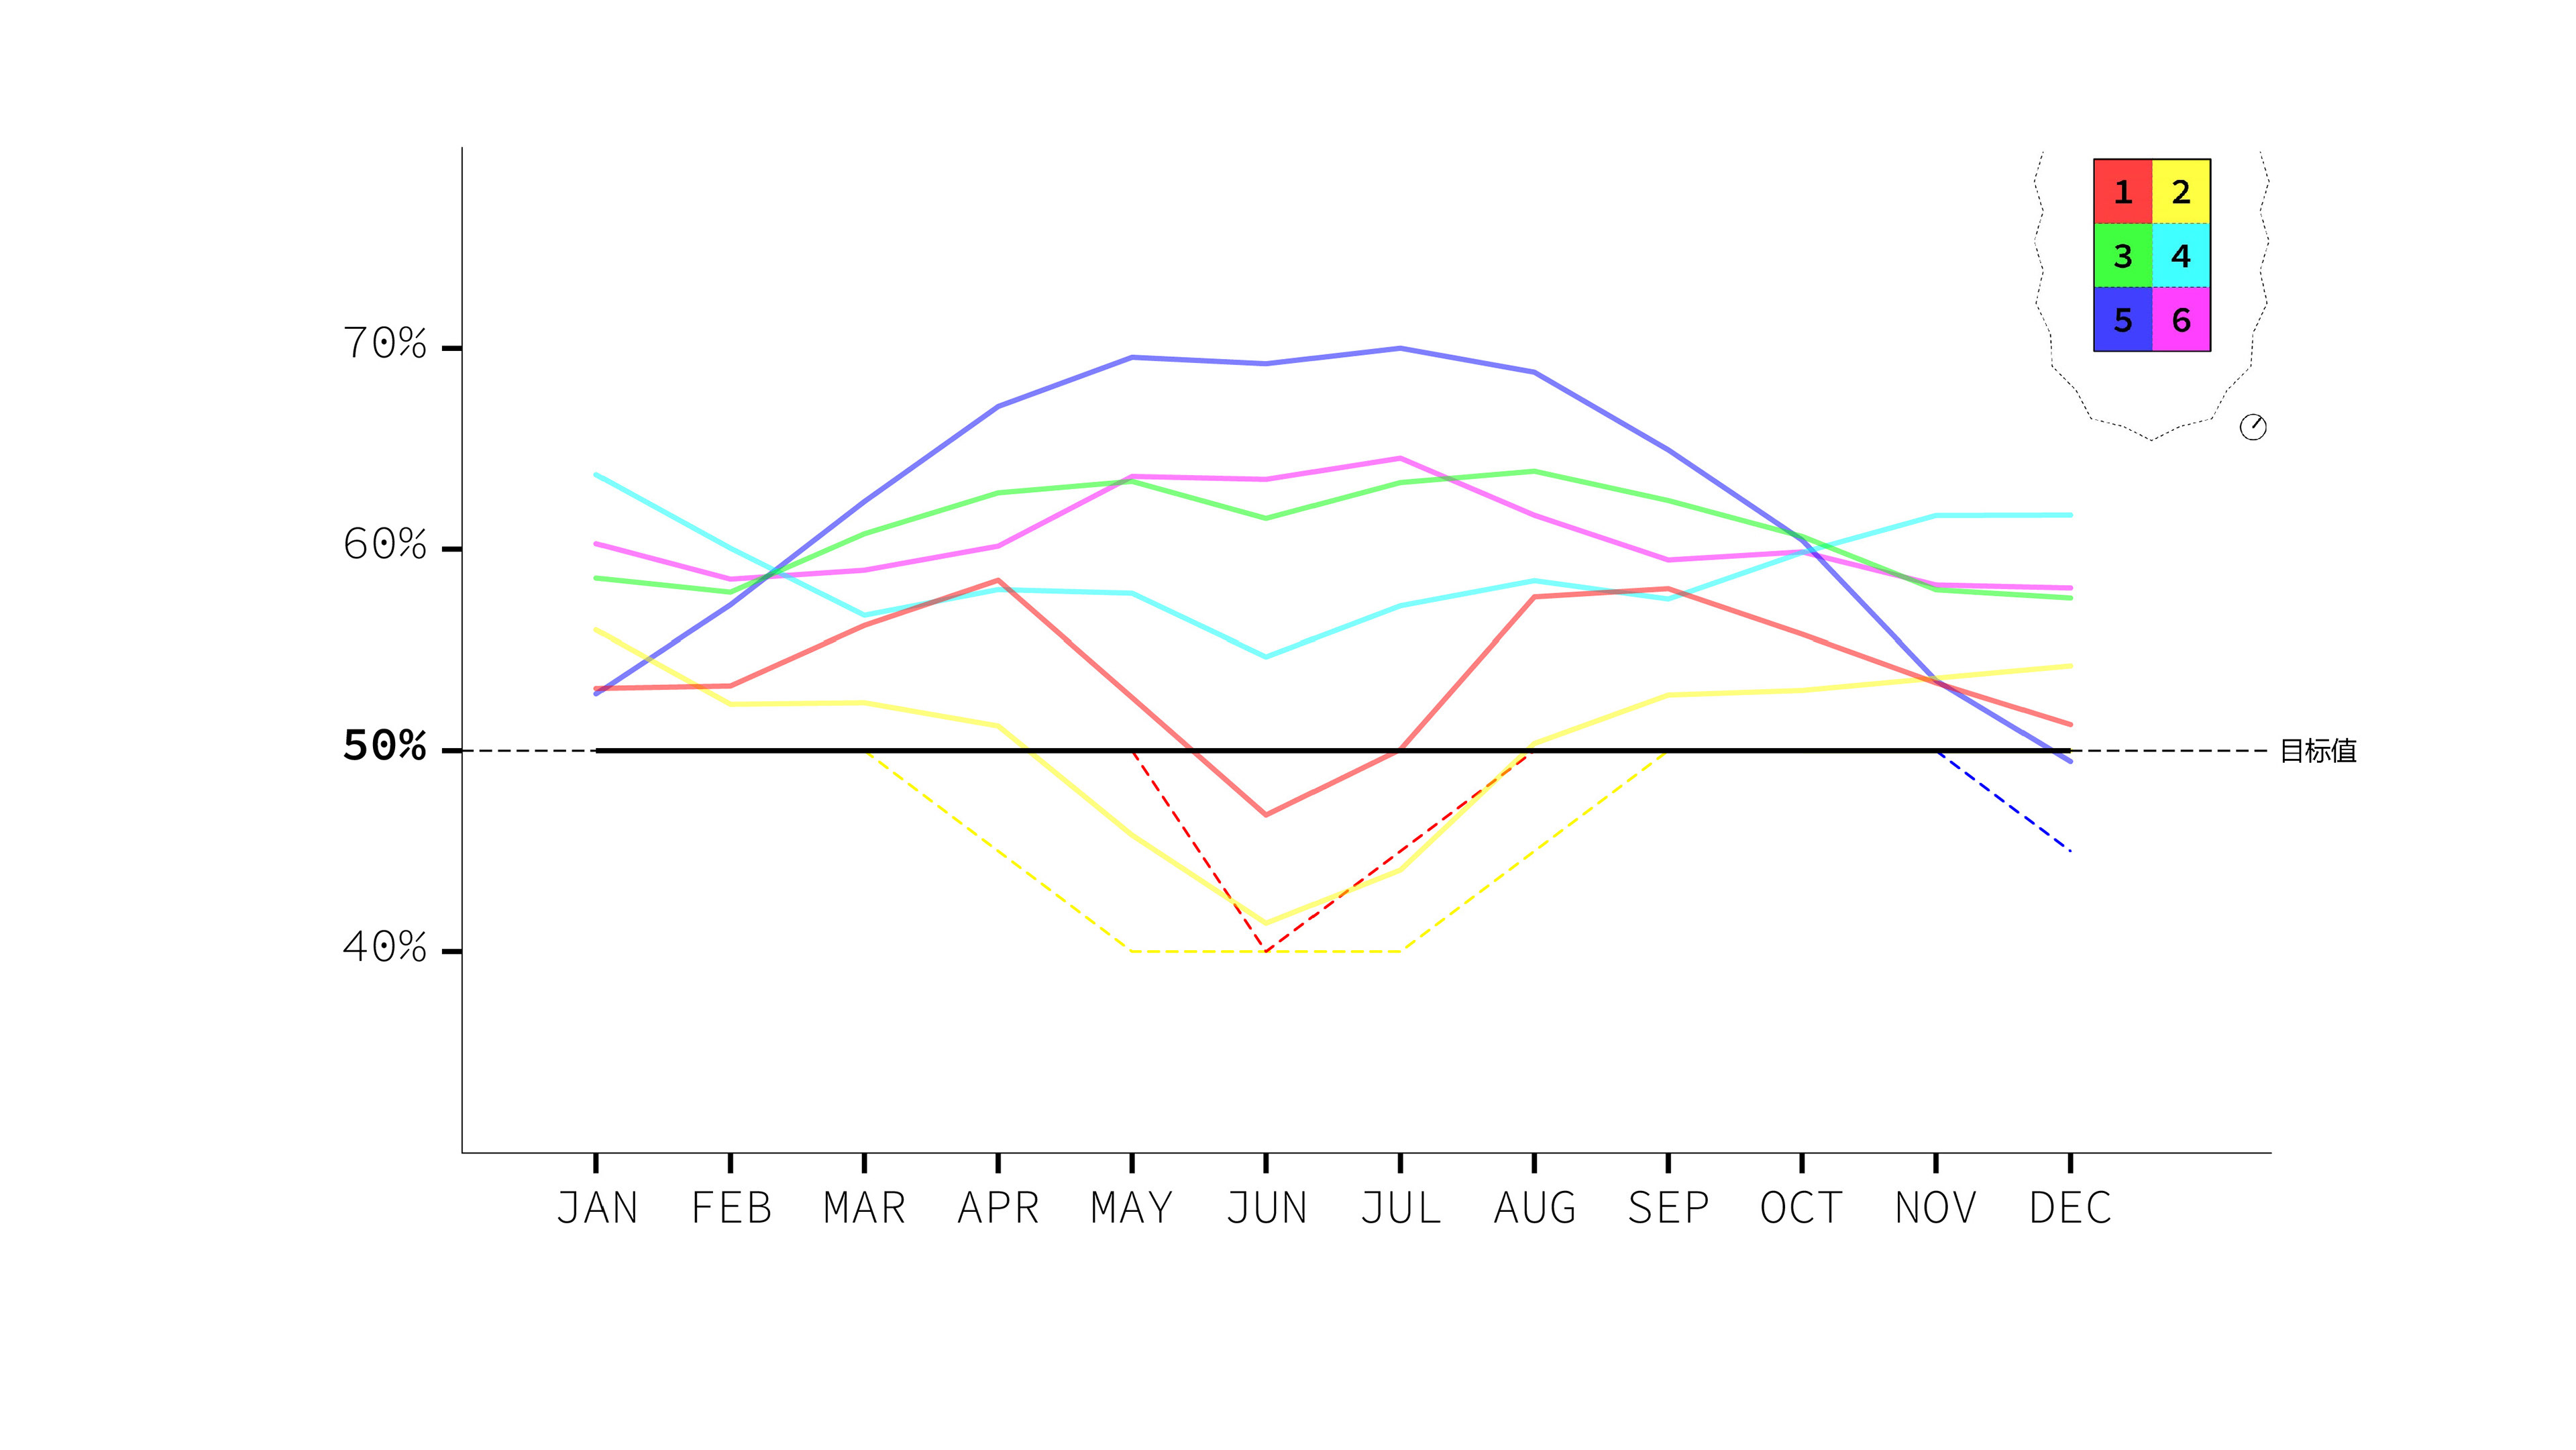
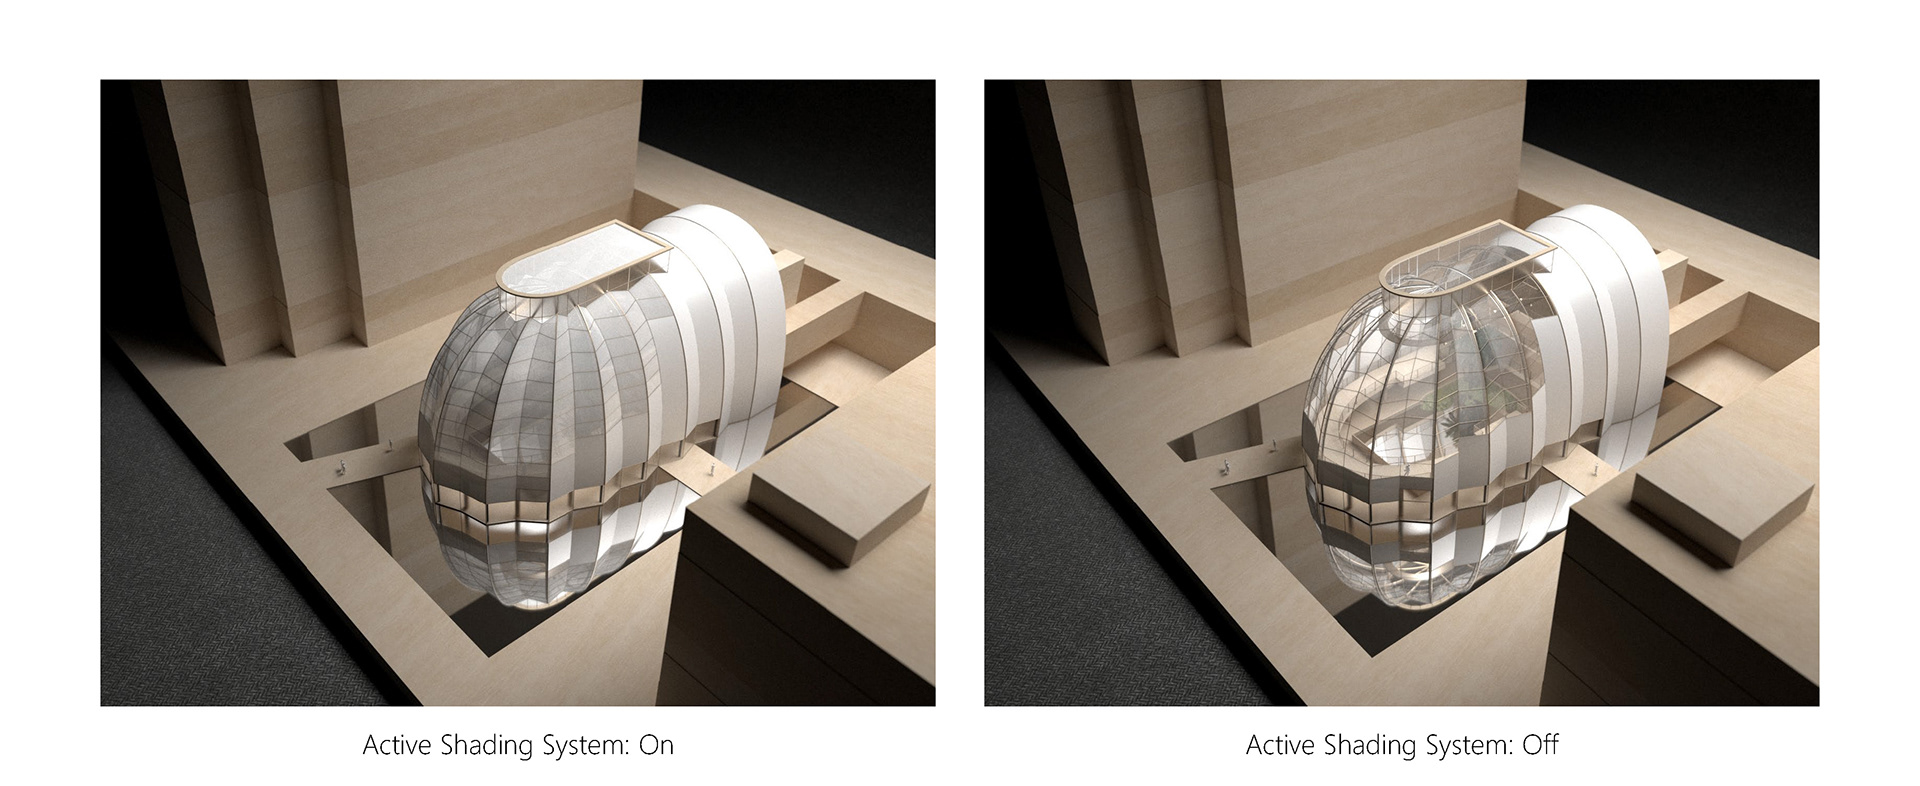
The monthly UV intensity analysis indicates that when the membrane structure is fully open, certain zones remain unable to meet the 50% benchmark due to fixed architectural obstructions. Specifically, Zones 1, 2, and 5 experience inherent limitations where UV levels fall short during certain periods, even with maximum sunlight exposure. To accommodate these constraints, their target intensity was adjusted to 5–10% below their maximum achievable levels, while all other zones retained the original 50% target.
Positioned between southwest and northeast high-rises, the site encounters an unavoidable physical limit—some tank areas remain restricted by a UV "hard ceiling" imposed by the surrounding buildings, regardless of the shading system’s configuration. Simulations indicate that Zone A2, for instance, is unable to reach the 50% target from April to August. Since natural light cannot be artificially increased in structurally shaded areas, a one-way control strategy was necessary, allowing only for light reduction but not supplementation. As a result, lower baseline UV targets were incorporated into the design for areas such as A1 and A2 from the outset.
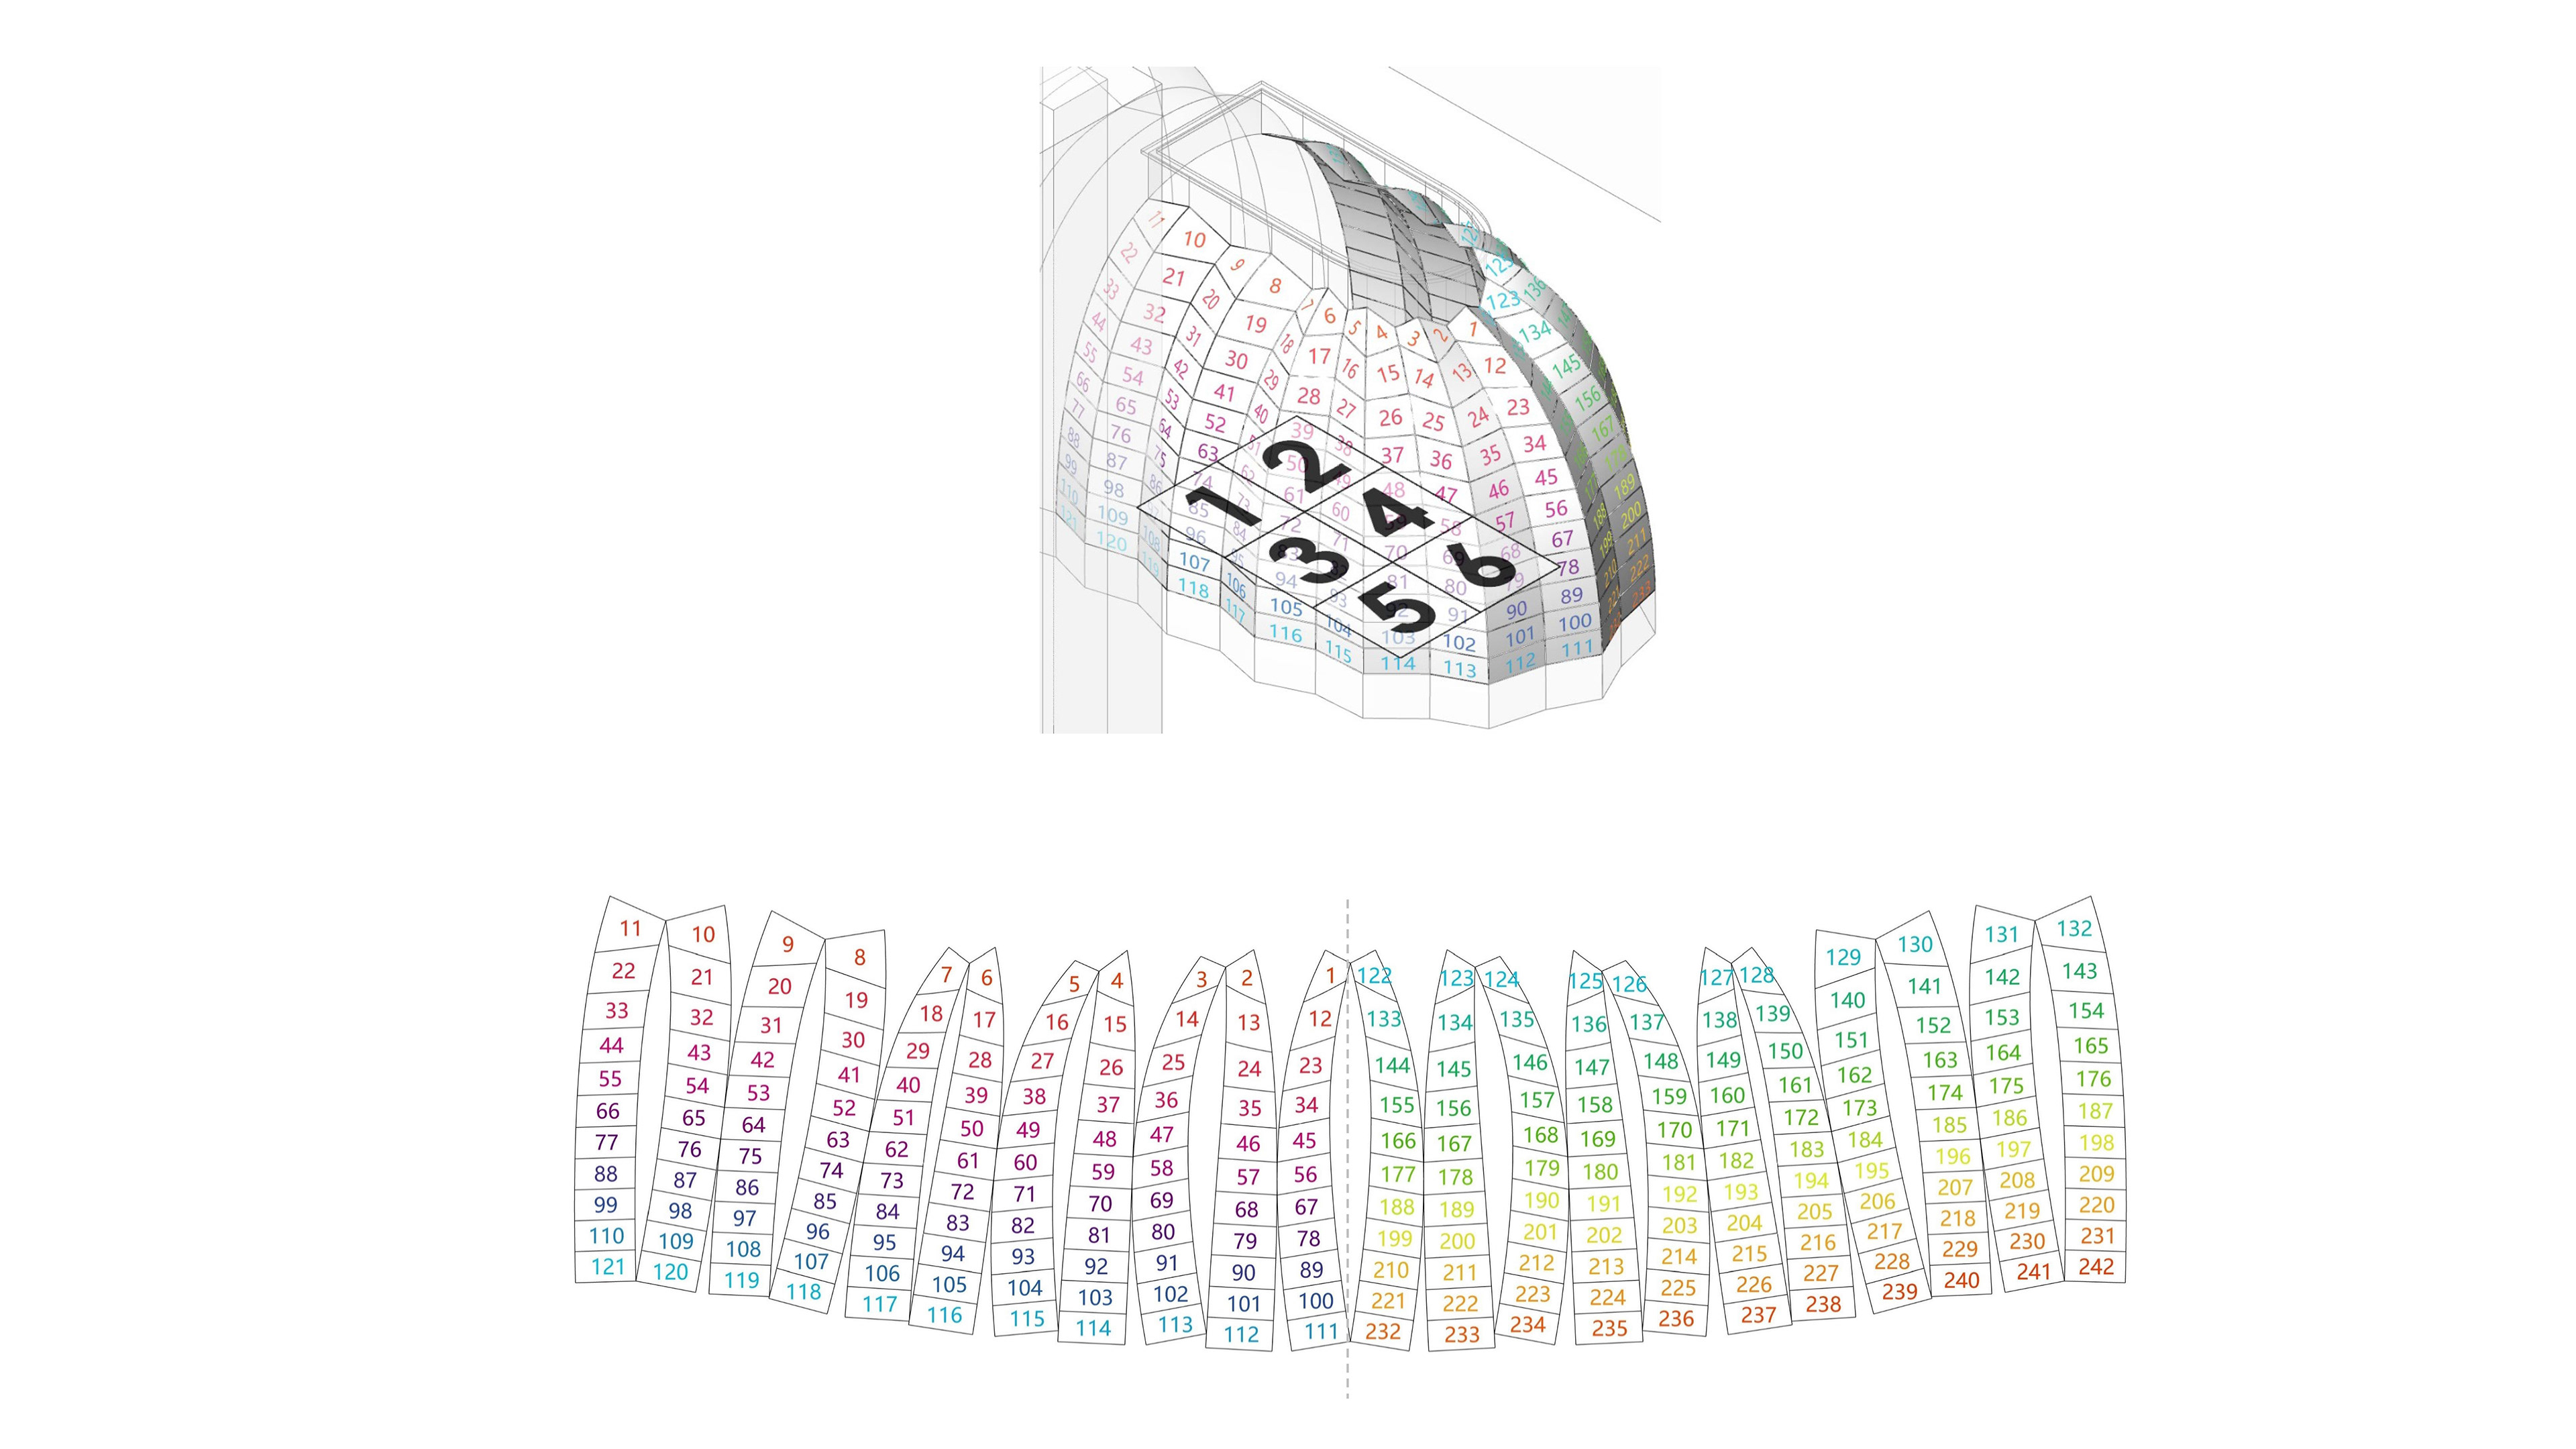
With 242 operable panels, each assigned a unique ID, an in-depth analysis was conducted to determine the impact of opening and closing each panel on the six target zones. To facilitate intuitive visualization, results were presented on an unrolled 2D plane using color-coded heatmaps and dynamic influence matrices.
The building’s shell was transformed into a grid of 242 panels, functioning like pixels on a digital screen. A "sunlight accounting system" was then developed to track the precise effect of each panel on the coral zones below. Each panel operates like a controlled sunlight faucet, with calculations determining the exact amount of light each should "pour" to maintain the 50% UV intensity target across all zones.
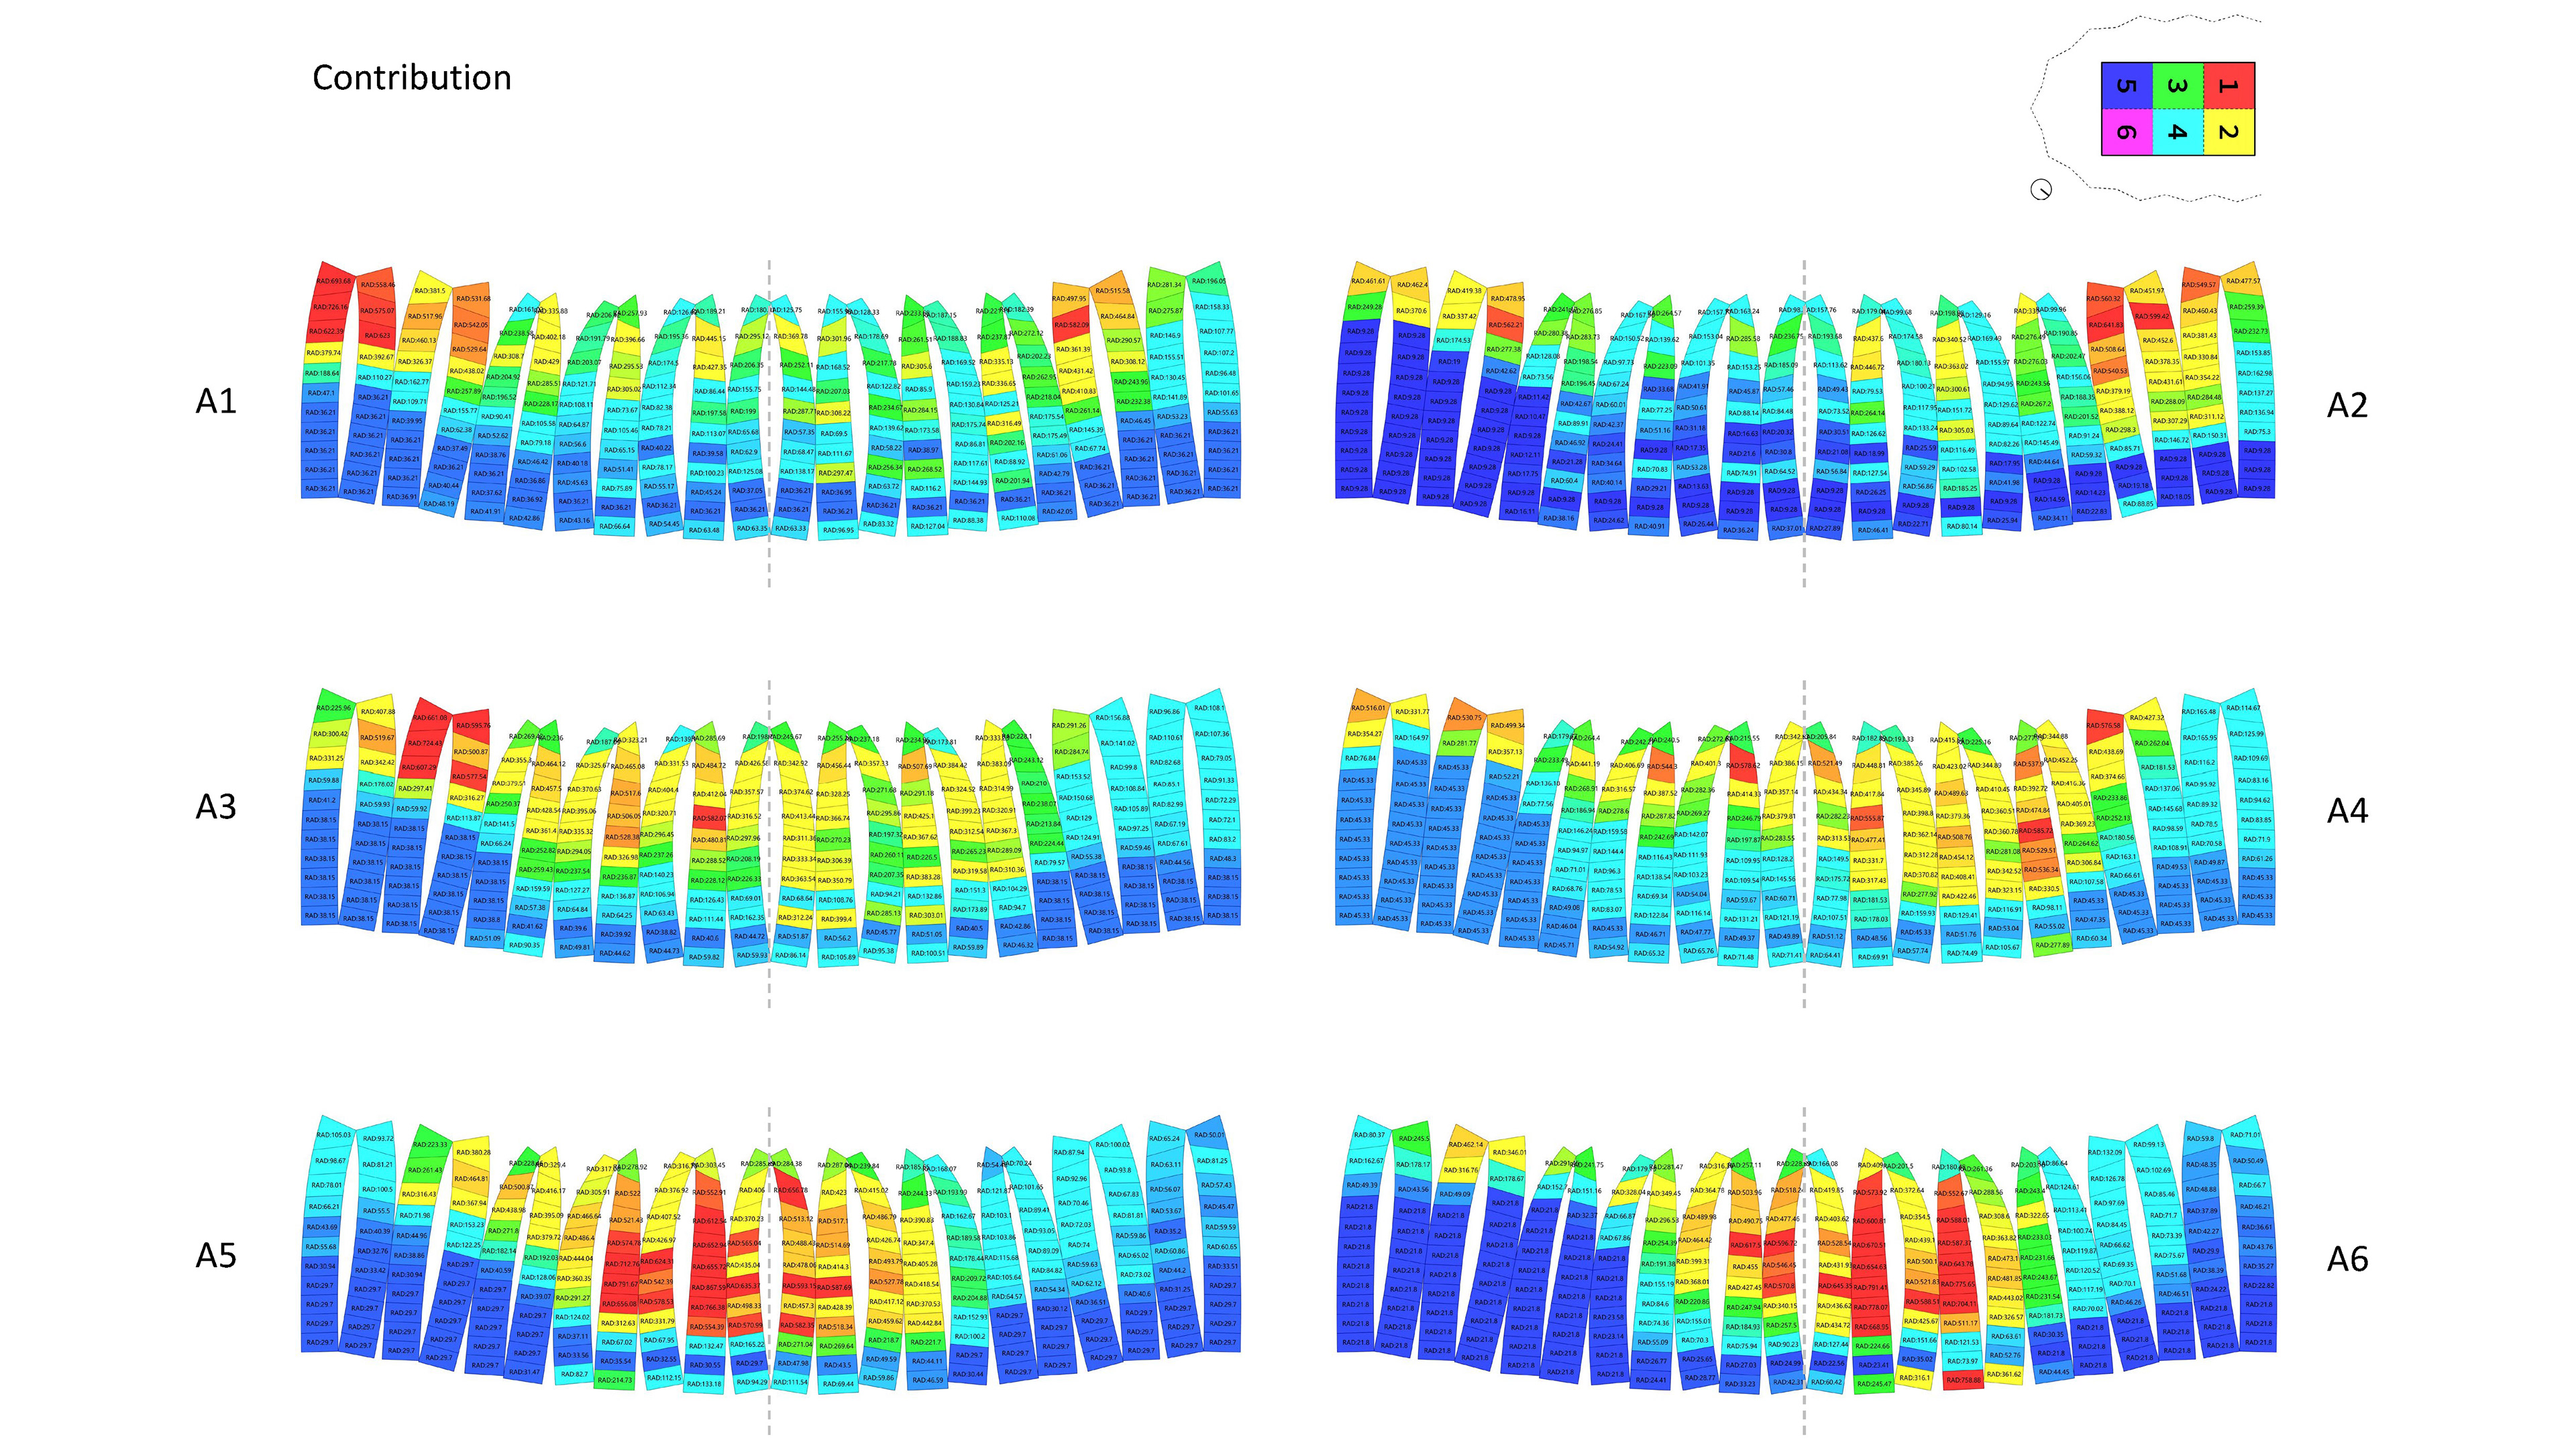
The mapping process involved tracking how each of the 242 operable panels contributed to maintaining the 50% solar radiation target for each coral zone. A color-coded system was used to visualize the impact, with red indicating critical areas where panels significantly blocked light, gradually fading to blue in regions where their influence was minimal.
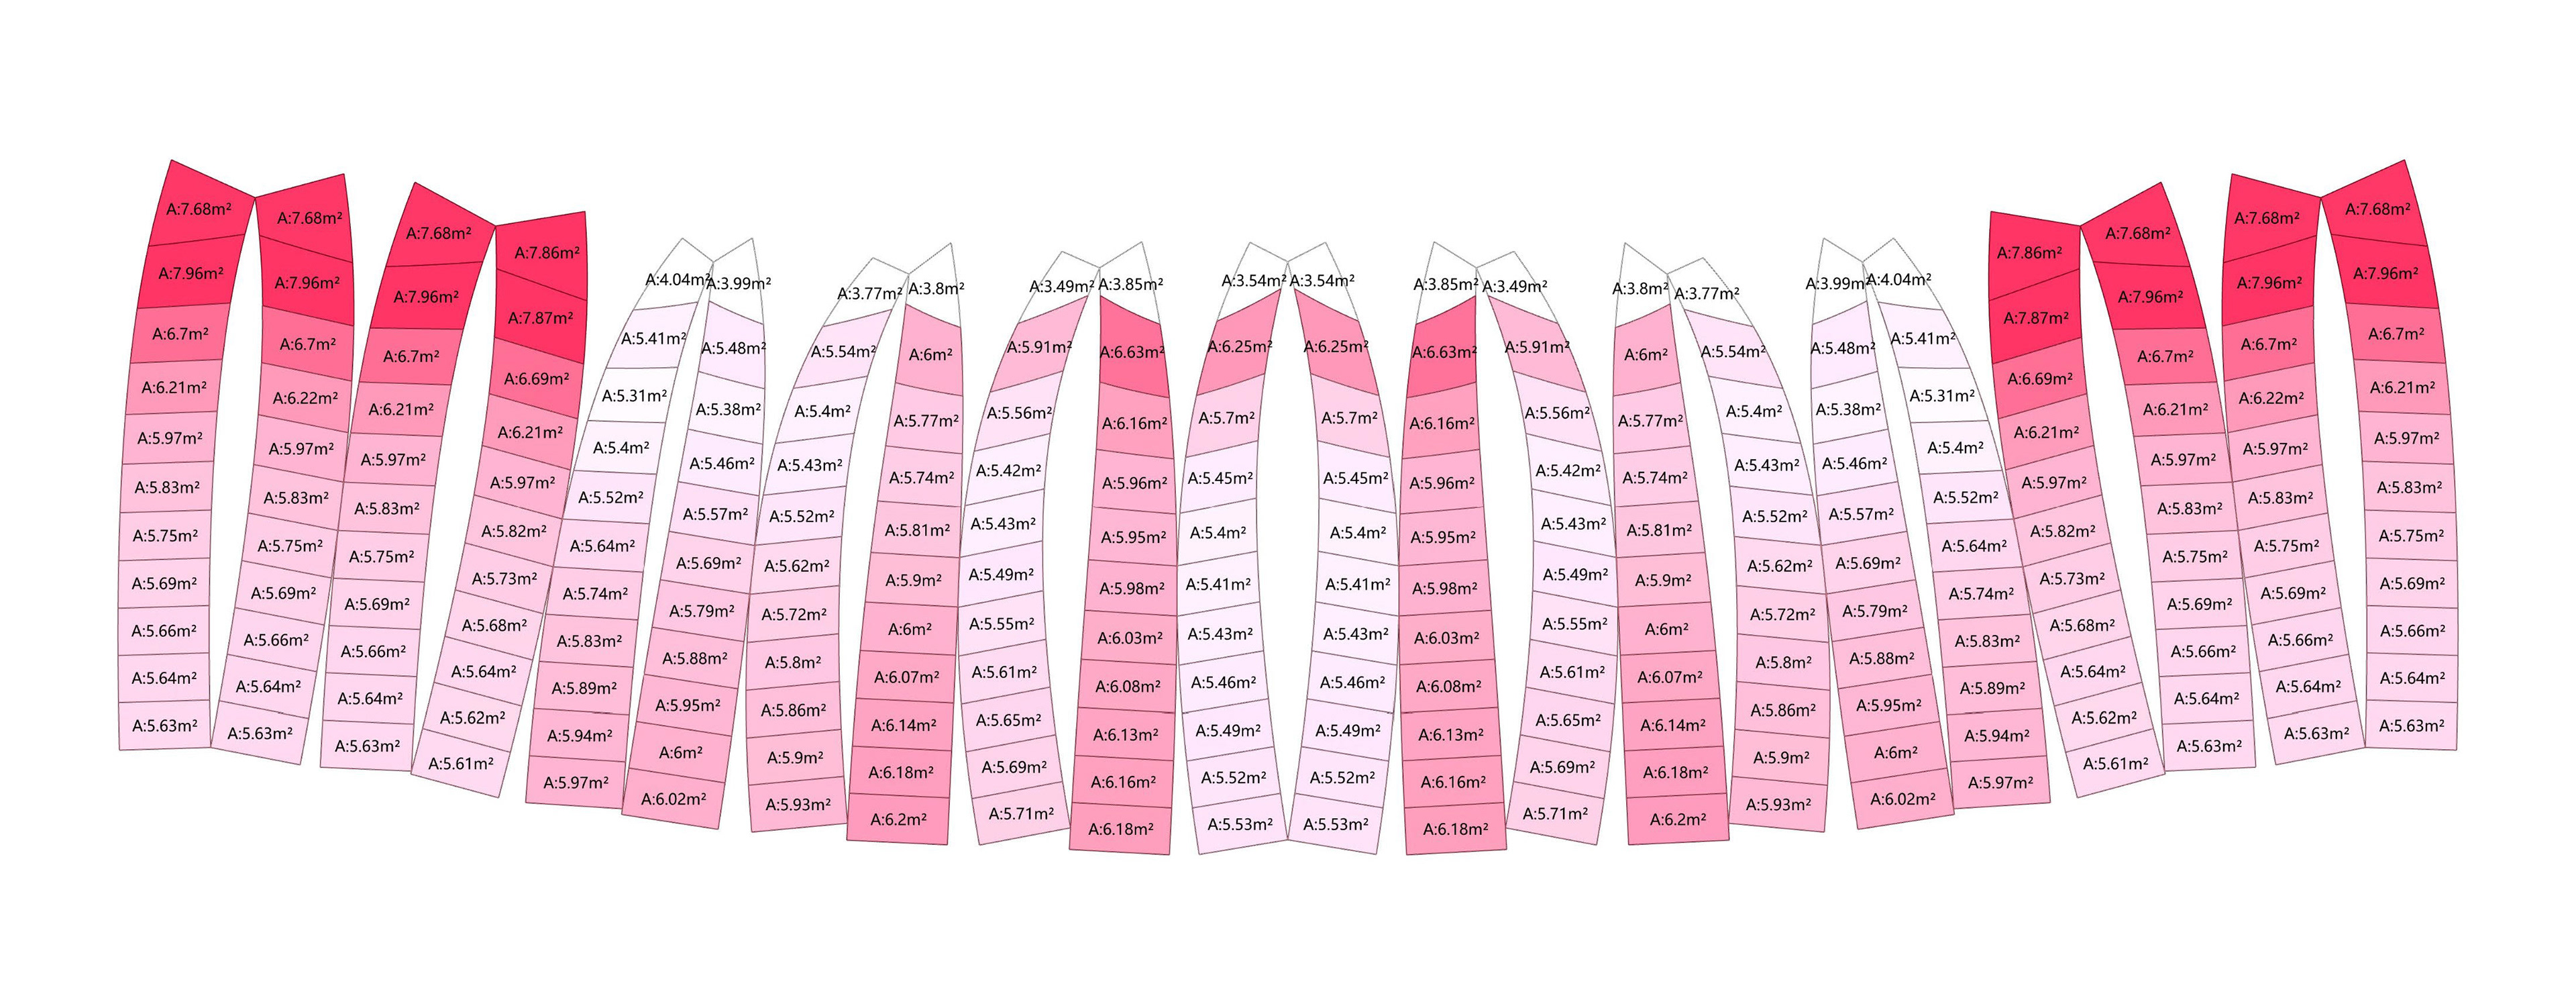
This optimization prioritizes UV efficiency per square meter, focusing on the cost-performance ratio rather than total UV intensity. To achieve this balance, area was introduced as a critical weighting factor, ensuring that material investment yields the most precise UV control for coral cultivation.
Since material costs are directly linked to panel size, certain units—despite being highly effective in achieving the 50% radiation target—required significantly larger surface areas. For instance, a panel contributing 15% to radiation control might demand 30% more material than standard units. This necessitated a trade-off analysis, carefully balancing efficiency gains against budgetary constraints to achieve optimal resource allocation.
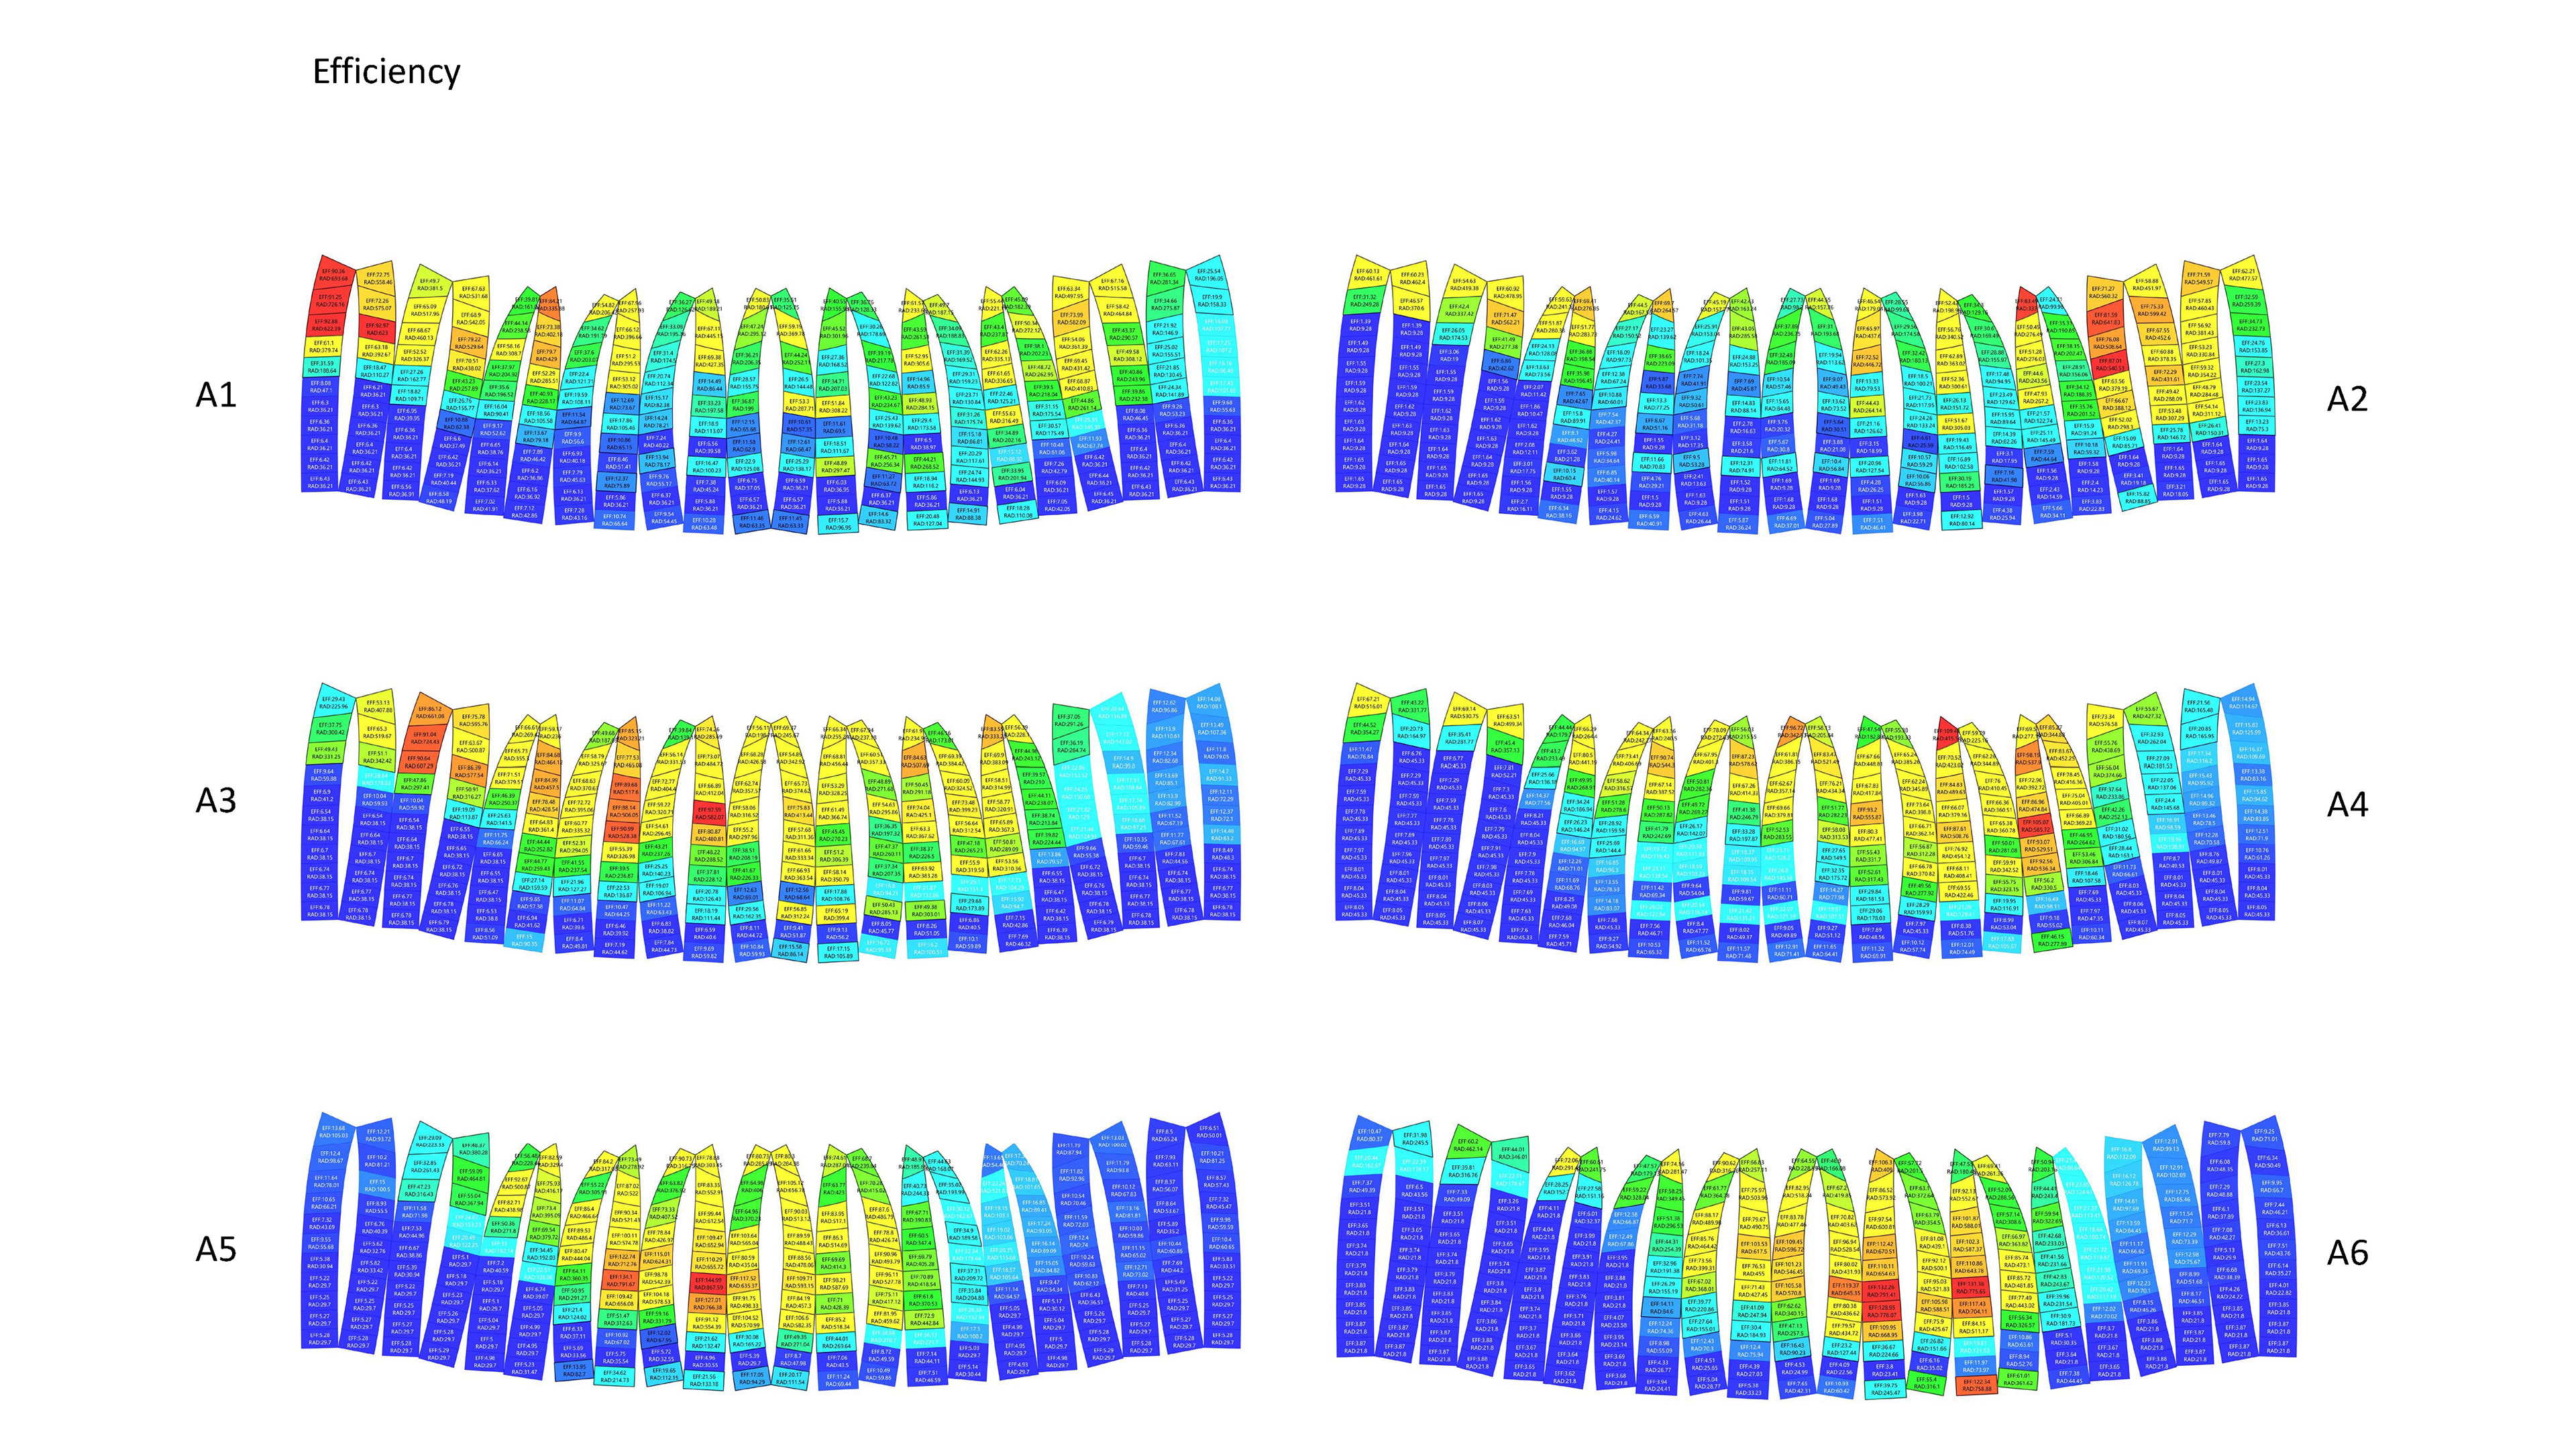
To optimize cost and performance, an efficiency ratio was established by dividing each panel's radiation contribution by its surface area. This algorithmic metric identifies the most cost-effective panels, ensuring that material investment yields the highest return in sunlight regulation. On the heatmap, the reddest panels represent units delivering the greatest sunlight control per unit of material used, effectively pinpointing areas where each dollar spent maximizes progress toward the 50% radiation target.
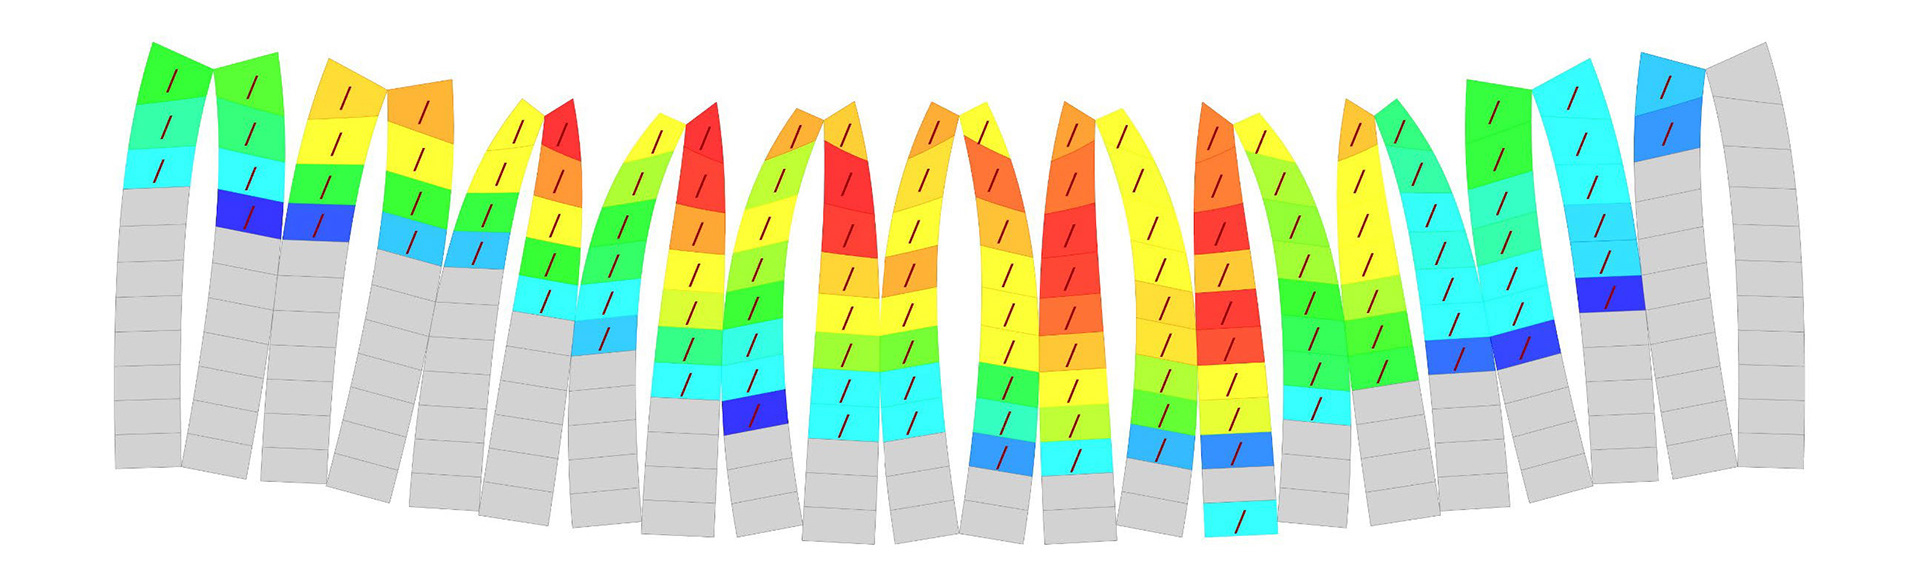
By stacking each panel’s UV efficiency—measured as UV transmittance per unit area—and applying optimization filters, a visual representation was generated. The red-to-blue gradient indicates varying efficiency levels, gray marks PTFE material zones, color-coded sections denote ETFE deployments, and hatched patterns highlight retractable shading components.
To refine material distribution, the effectiveness of each panel across all six coral zones was analyzed, creating a priority ranking of the 242 panels based on their cost-benefit impact. Clearer materials, such as ETFE, were strategically placed where they provided the greatest contribution to achieving the 50% radiation target at the lowest cost, while standard materials were allocated to less critical areas to optimize resource efficiency.
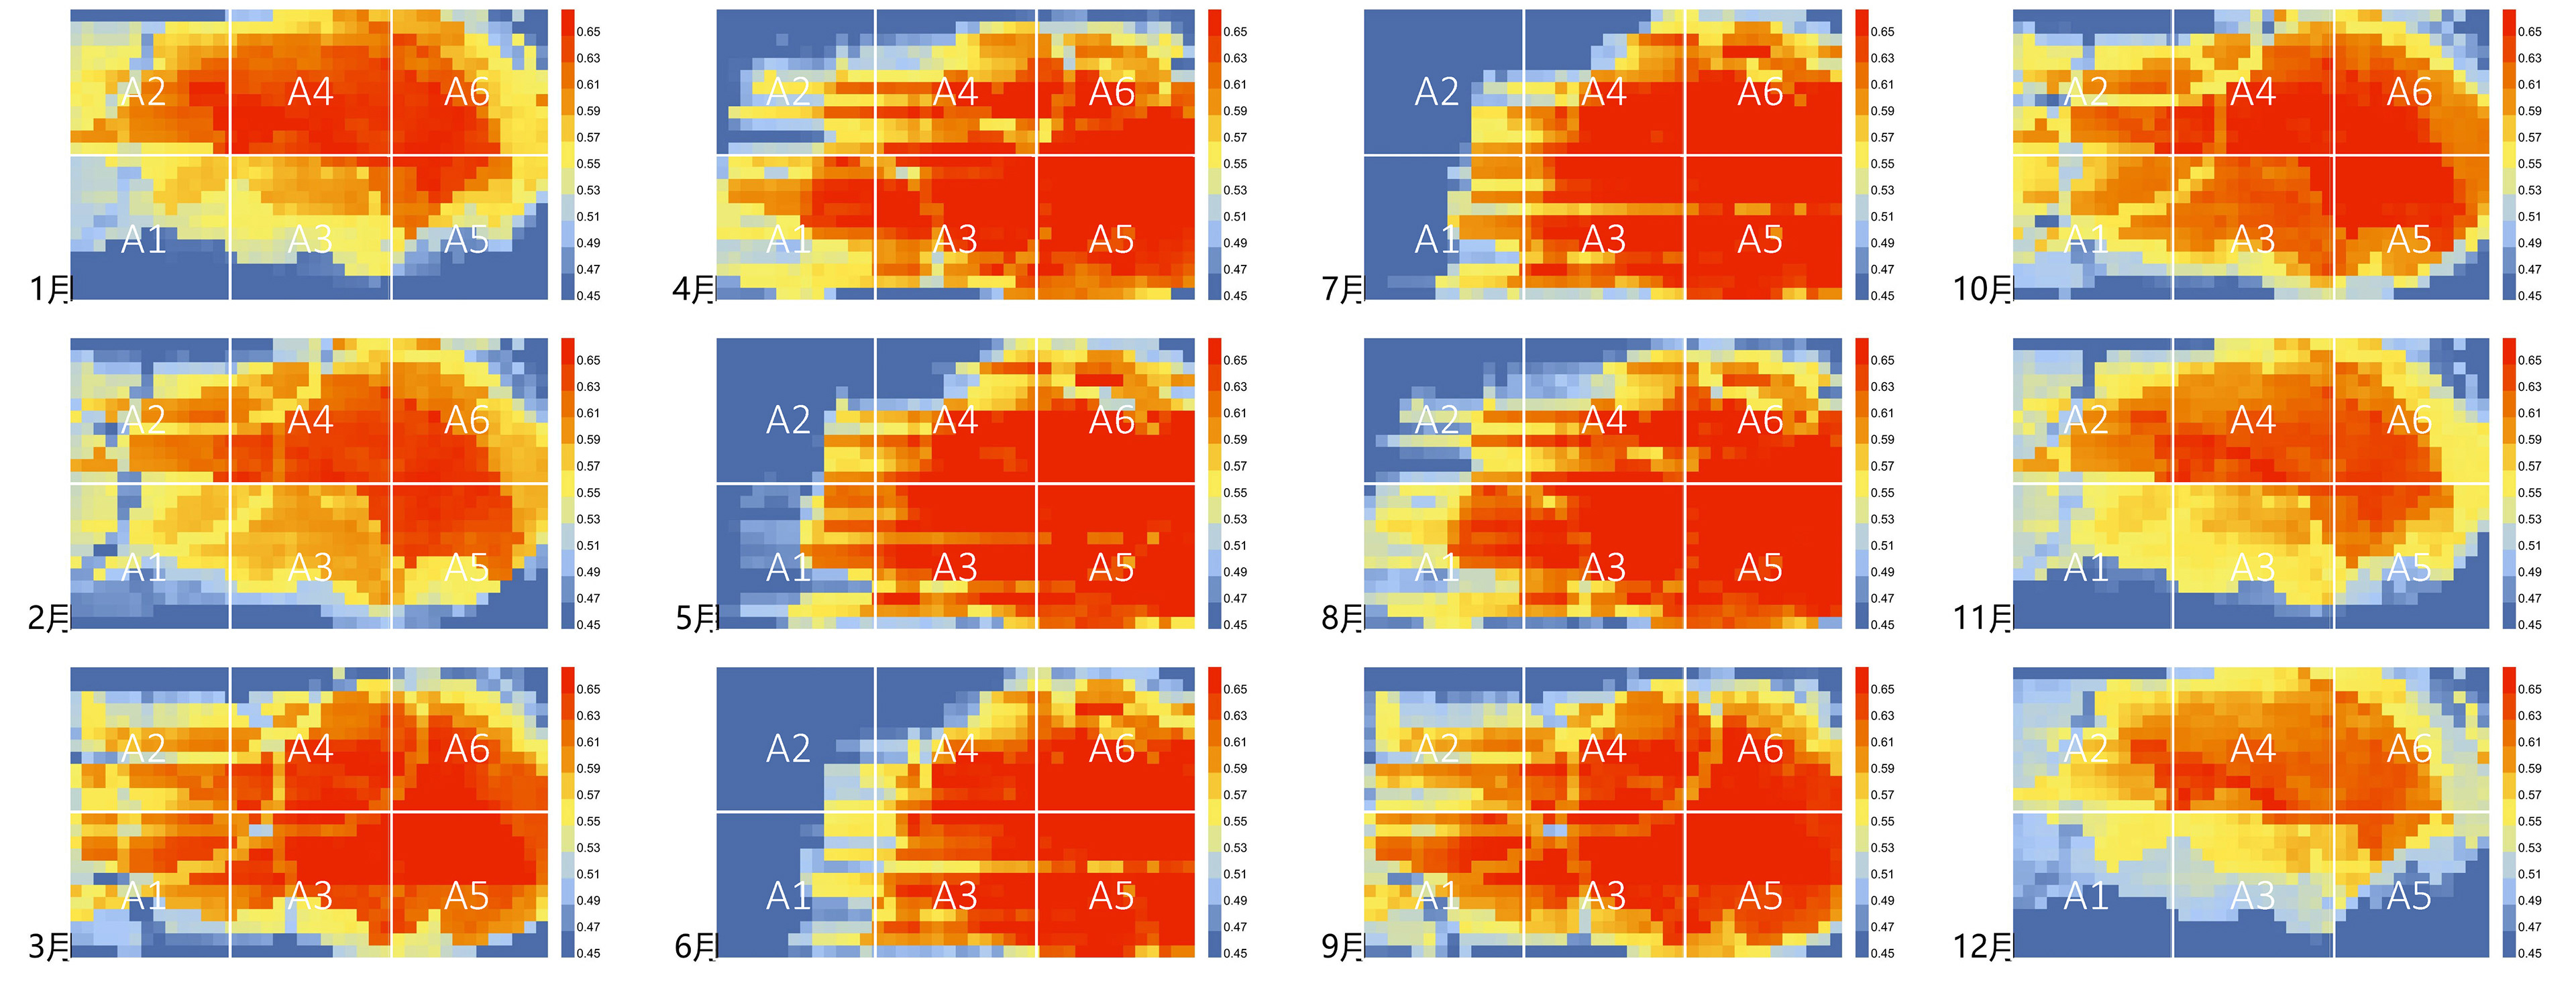
This visualization represents the post-optimization validation, demonstrating consistent monthly compliance with the 50% solar radiation target across most cultivation zones.